Analytics-DA-201 Salesforce Certified Tableau Data Analyst Questions and Answers
You have the following box plot that shows the distribution of average profits made in every state by region.
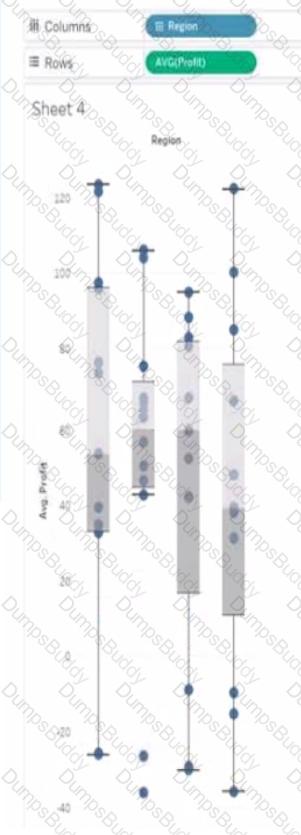
Which region has the smallest distribution of profits?
A Data Analyst needs to filter a view to include only events that have occurred year to date.
Which formula accomplishes this?
A Data Analyst is creating a map that includes multiple data layers at country, state, and city levels. Users want to customize their map by turning layers on and off as needed.
How should the analyst provide this functionality?
A Data Analyst has the following dataset.
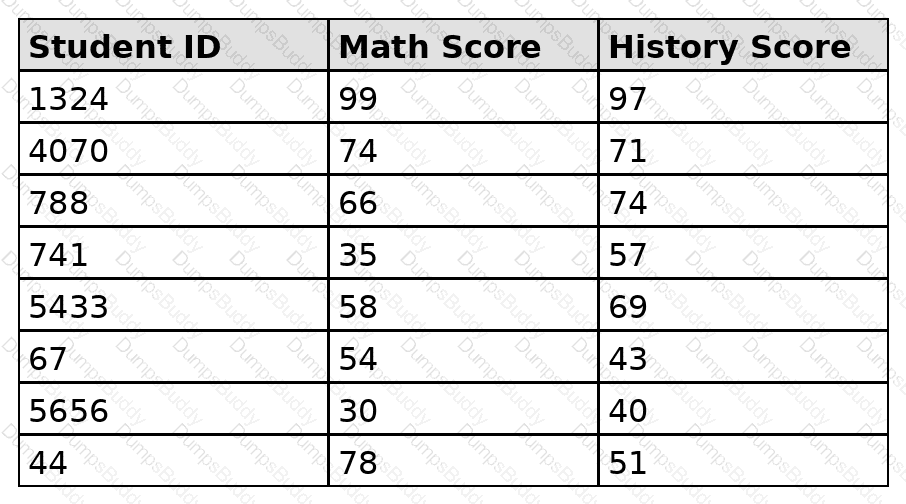
The analyst needs to analyze the relationship between math scores and history scores as shown in the following exhibit.
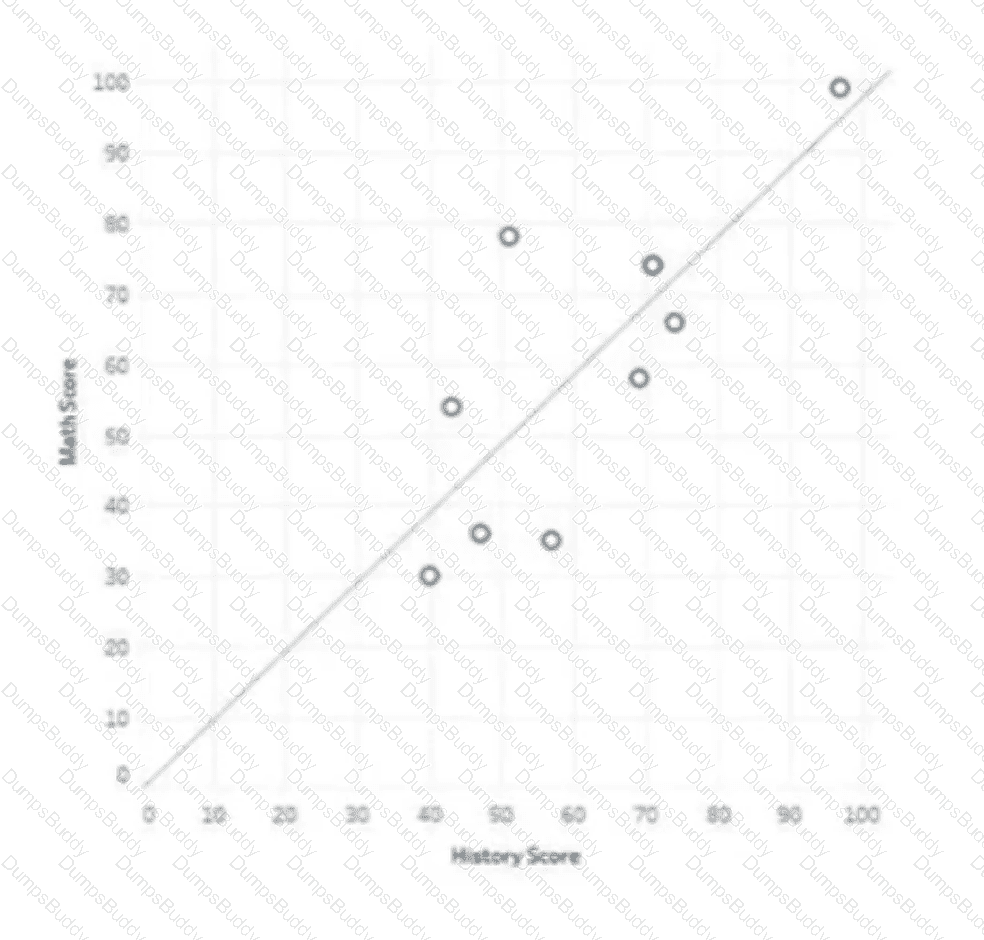
Which three actions should the analyst perform? Choose three.
You have the following visualization.
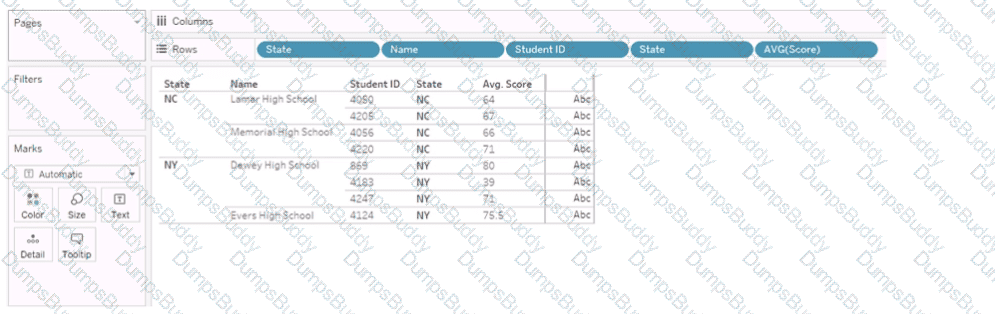
You Create a table calculation named Rank_Score that has a formula of RANK(AVG([Score]), and you drag Rank_Score to Text on the Marks cards.
What is the Rank Score value for Student ID 4220?
A Data Analyst has the following dataset:
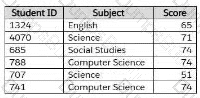
The analyst wants to create a new calculated dimension field named Category that meets the following conditions:
When Subject is Computer Science or Science, the Category must be Sciences.
When Subject is English or Social Studies, the Category must be Humanities.
Which two logical functions achieve this goal? (Choose two.)
You have the following dataset.
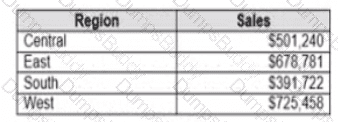
Which Level of Detail (LOD) expression should you use to calculate tie grand total of all the regions?
You have the following chart that shows profits and discounts over time.
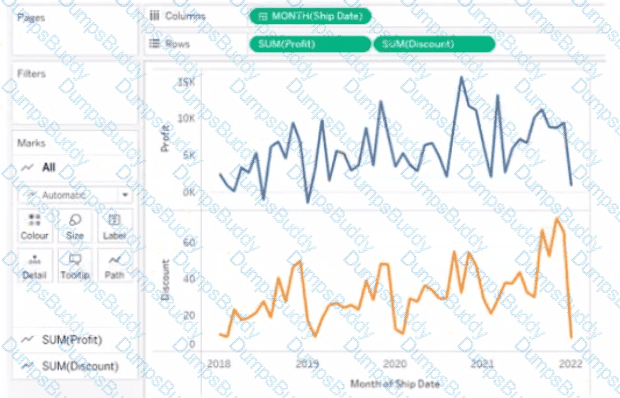
You need to combine the lines to appear as shown in the following chart.
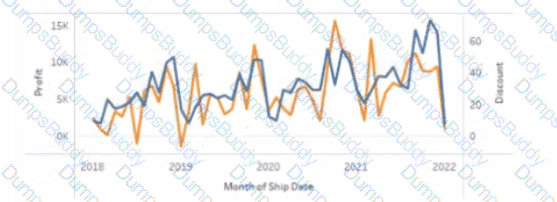
What should you do?
A Data Analyst has the following dataset in Microsoft Excel.
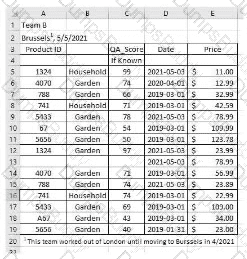
The analyst is using Data Interpreter to cleanse the dataset. Data Interpreter provides the following results.
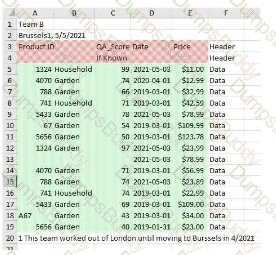
How many rows of data will be ingested into Tableau as values?
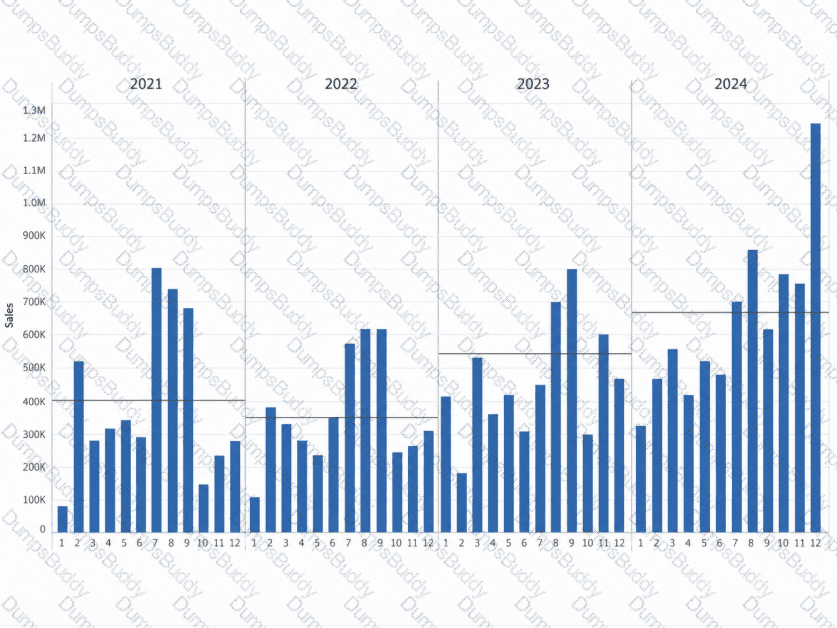
How should a Data Analyst configure the reference lines so that they appear as shown in the following chart?
You have the following dataset.
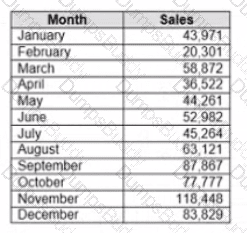
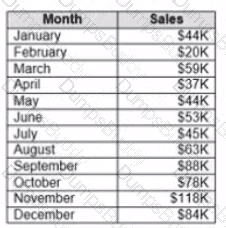
When you use the dataset in a worksheet, you want Sales to appear automatically as shown in the following table.
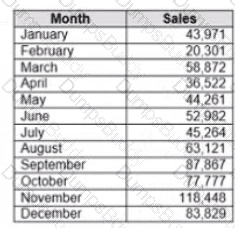
What should you do?
Below are some of the values in the Order_ID field:
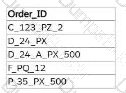
Which calculation should a Data Analyst use to return the two-letter combinations starting with the letter " P " for each of these values?
A Data Analyst has the following sets in a Tableau workbook:
Top N Customers
Customers of 2024
Top N Products
Sellers of 2024
Which two sets can the analyst combine? (Choose two.)
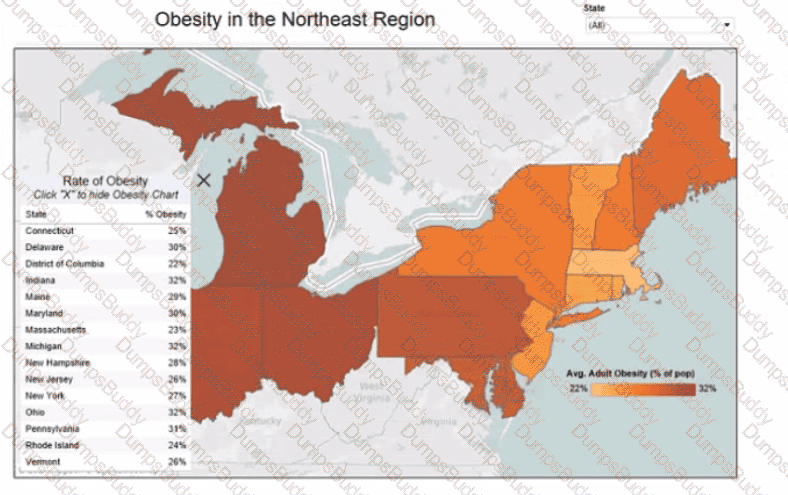
You create a worksheet named Sales by Region and hide the tide of the worksheet. You print the worksheet as a PDF and notice that the worksheet title appears. You need to prevent the title from appearing when you print the worksheet as a PDF. Which settings should configure from the File menu in Tableau Desktop?
You have a sales dataset that contains the following fields.
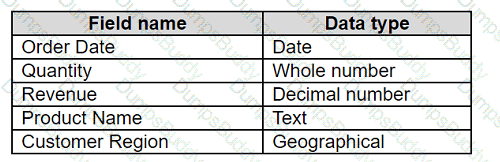
You need to analyze the average revenue per product in different regions over time.
Which two fields should be measures? Choose two.
You have the following worksheet.
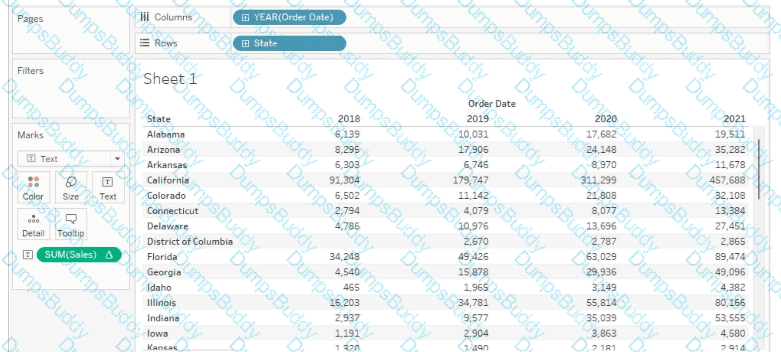
You want to create a table calculation that shows sales growth over each year.
How should you complete the formula? (Use the dropdowns in the Answer Area to select the correct options to complete the formula.)


A Data Analyst has a dataset that contains people and the awards they have won.
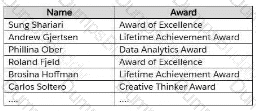
Which formula should the analyst use to get the number of different types of awards that have been won?
You want to add a draft watermark to a dashboard as shown in the following exhibit.
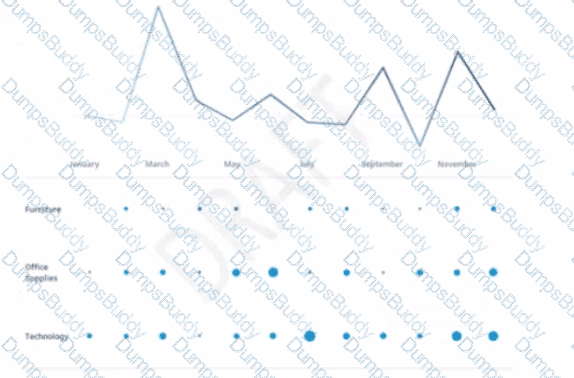
Which type of object should you use?
You have the following dashboard.
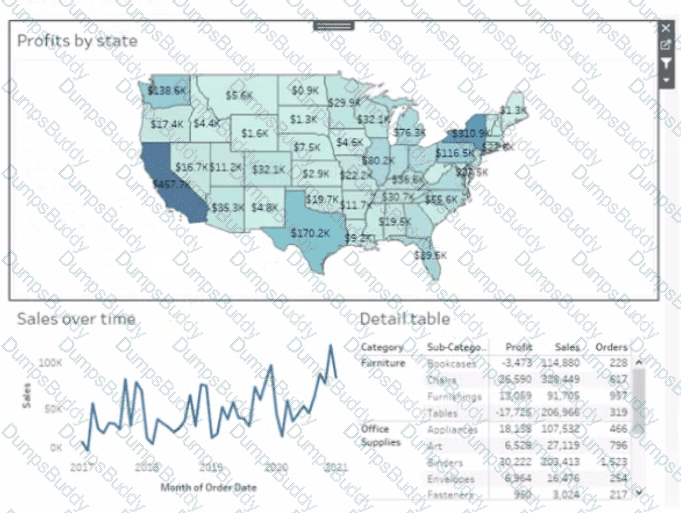
Currently the map is used as a filter that affects the data on the otter sheets of the dashboard
You need to configure the dashboard to ensure that selecting a data point on the map only tillers the Detail table
What should you do?
When using Tableau Desktop to connect to a published data source on Tableau Cloud or Tableau Server, which data sources will be displayed to the user?
You have a workbook that connects to a database. The database requires authentication.
You plan to publish the workbook and schedule a daily refresh of the data.
Which two conditions must be met to schedule the refresh? Choose two.
A Data Analyst has two tables named EmployeeInfo and DepartmentInfo. EmployeeInfo contains four fields named Full Name, Department ID, Start Date, and Salary. DepartmentInfo contains four fields named Department Name, Size, Department ID, and VP. The analyst wants to combine the tables to meet the following requirements:
EmployeeInfo is the first table that is dragged to the canvas,
The records must contain the Full Name, and the Department Name, Size, and VP fields if available,
Not all records have an exact match.
Which type of join should the analyst use?
A Data Analyst has the following dashboard.
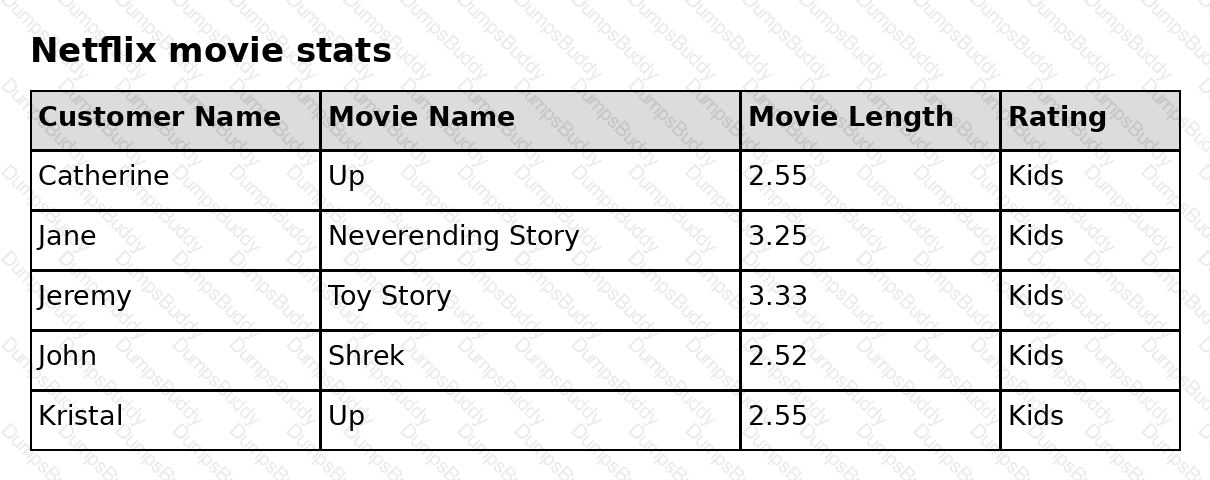
The analyst wants a specific web page to open in the default web browser when a user clicks the sheet.
What should the analyst do?
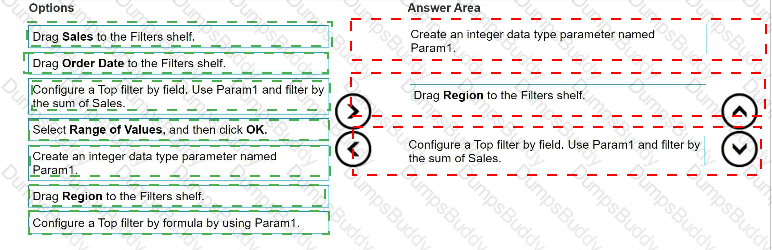
You have a data source that contains the following columns.
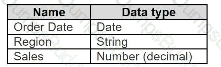
You want to filter regions based on the highest sales. Users must be able to specify the number of regions shown.
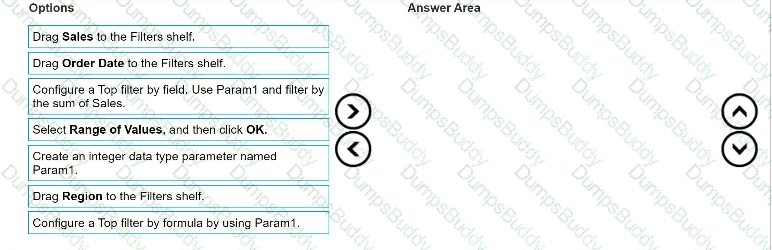
Which three actions should you perform in order? (Place the three correct options in order. Use the arrows to move Options to Answer Area.
Use Answer Area arrows to re-order the options.)
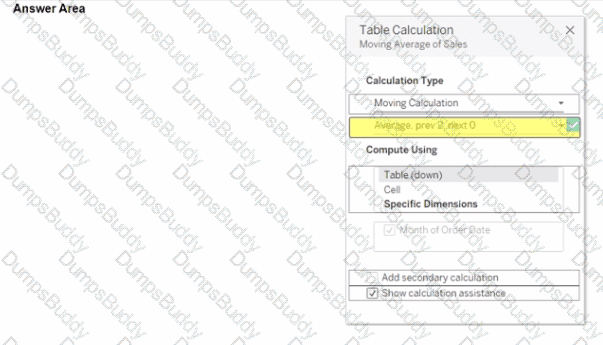
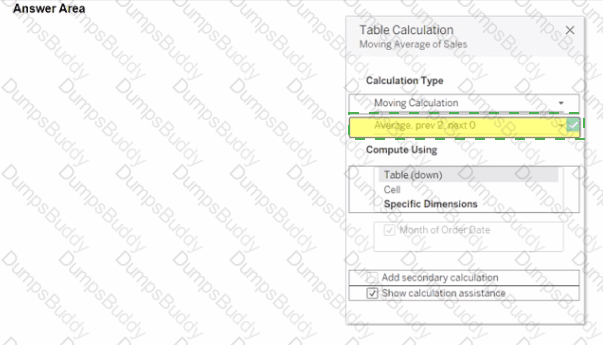
You use a quick table calculation lo calculate the moving average of a measure named Sales.
You need to calculate the moving averages of the last three years.
Which setting should you change in the Table Calculation dialog box? {Click the appropriate Option in the Answer Area)
A Data Analyst has a sales dataset that contains the following fields.
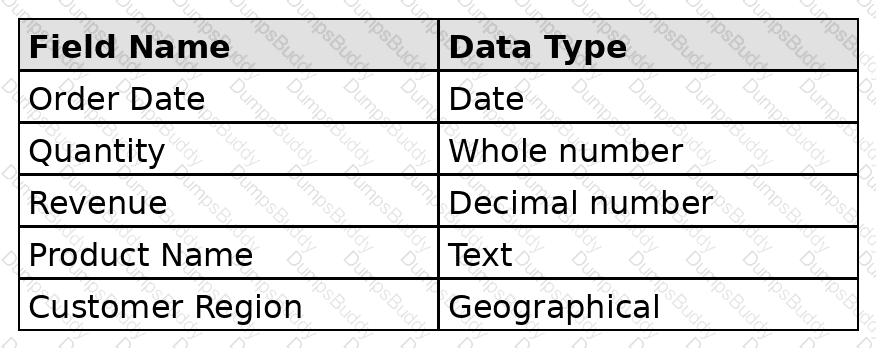
The analyst needs to analyze the average revenue per item sold in different regions over time.
Which two fields should the analyst measure? Choose two.
A Data Analyst applied a dimension filter to a worksheet with FIXED Level of Detail (LOD) calculations.
How does this filter affect the worksheet?
What is required to publish a data source to Tableau Server or Tableau Cloud from Tableau Desktop?
You need to change the values of a dimension without creating a new field.
What should you do?
A Data Analyst loads a dataset from Microsoft Excel. The following is a sample of the data.
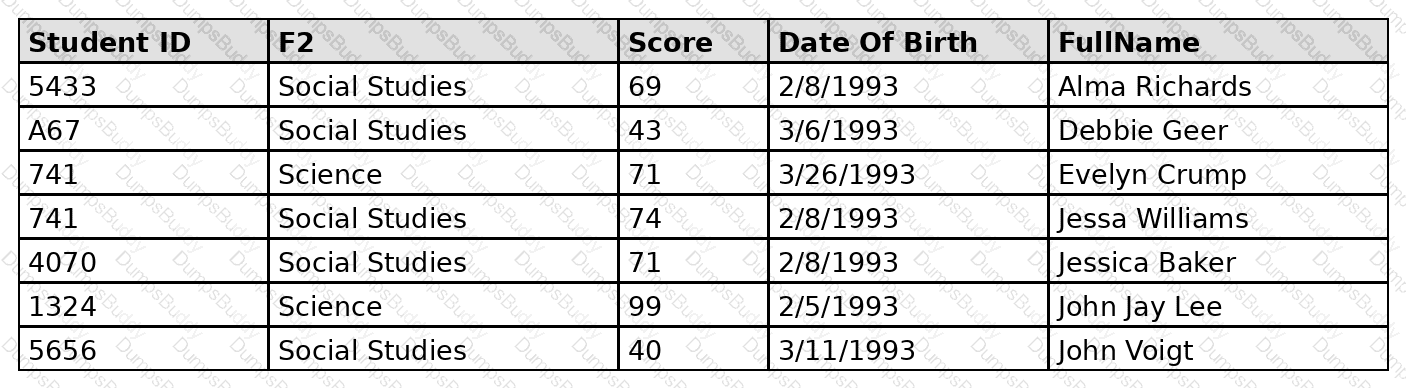
FullName contains student names. Some names contain a first name and a last name. Some names contain a first name, a middle name, and a last name.
The analyst needs to divide FullName into three separate fields: one for the first name, one for the middle name, and one for the last name. The solution must minimize effort for the analyst.
What should the analyst do?
A Data Analyst decides to add custom shapes to some key performance indicators (KPIs) in order to indicate their performance.
How should the analyst make the custom shapes available in a workbook?
A Data Analyst has the following chart that shows the cumulative volume of sales from various dates.
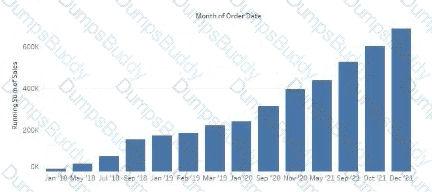
The analyst wants the months to appear as shown in the following chart.
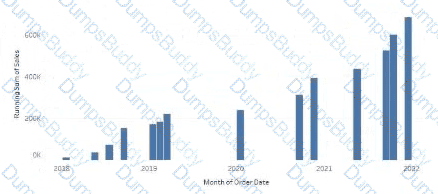
What should the analyst do?
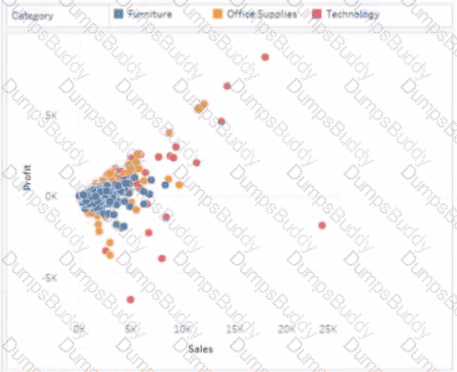
You have a dataset that has four fields named Category. Profit Sates and Customer Name. You need to create the following visualization.
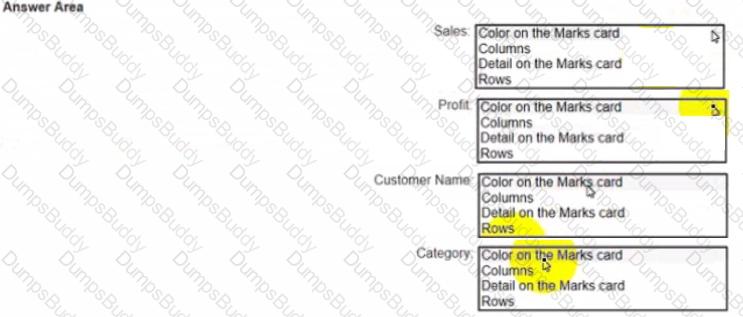
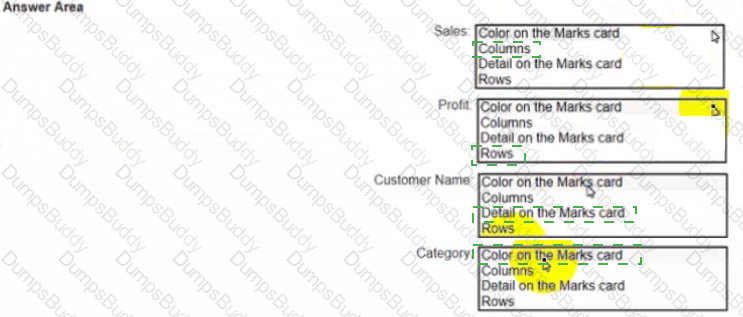
You are the owner of an alert.
You receive an email notification that the alert was suspended
From where can you resume the suspended alert?
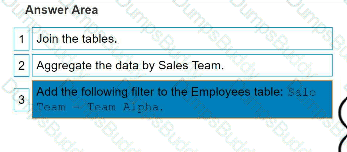
You are developing a data source in Tableau Prep.
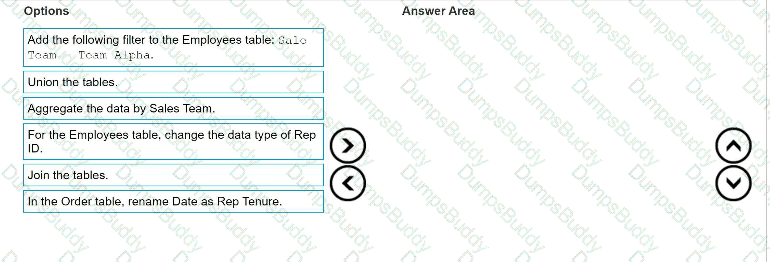
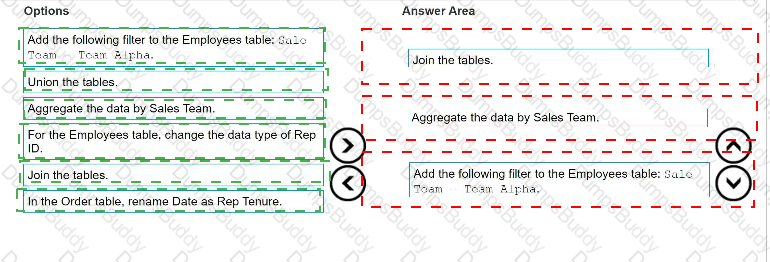
You have two tables named Orders and Employees.
The Orders table was created in 2019 and contains the following columns.

The Employees table contains all the employee information for the various sales teams in the sales department and contains the following columns

You want to prepare the data so that you can analyze sales trends over time for every sales team.
Which three actions should you perform in order? (Place the three correct options in order. Use the arrows to move Options to Answer Area. Use Answer Area arrows to re-order the options.)
You plan to create a Tableau subscription for several users.
Which two formats can you use? Choose two.
Which type of visualization interaction can a Data Analyst achieve using set actions?
You have the following map.
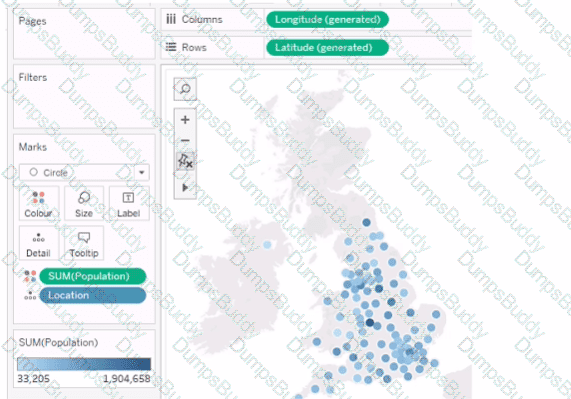
You need the map to appear as shown in the following visualization.
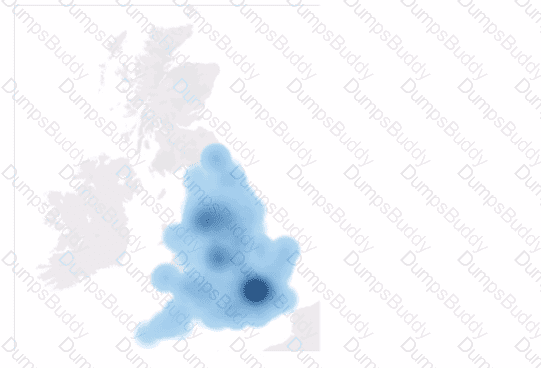
What should you do?
You company has two divisions located in the United States and Germany Bach division has a separate database. The following is a sample of the sales data for the division in the United States.
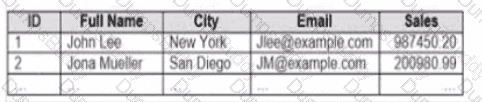
The following is a sample of the sales data for me division in Germany.
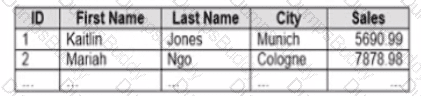
You have population data in a file named Populatio.csv. the following is a sample of the data.
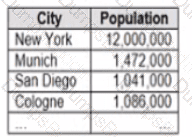
You plan to create a visualization that ml show tie sales per capita for each salesperson Each salesperson must be identified by identified by their full name.
You need to prepare the data to support the planned visualization. The data source must support being published .
Which four actions should you perform in order?
(Place the four correct options n order Use the arrows to move Options to Answer Area arrows to re-order the options.
Use Answer Area arrows to re-order the options)


A Data Analyst needs to create a dashboard to show sales rep revenue tracking against goals. The revenue data source has already been published to the corporate Tableau site. The goals data is stored in a Microsoft Excel file and must be updated on a regular basis by the sales managers.
How should the analyst set up the data sources to meet these requirements?
You want to create the following dashboard that will contain two sheets.
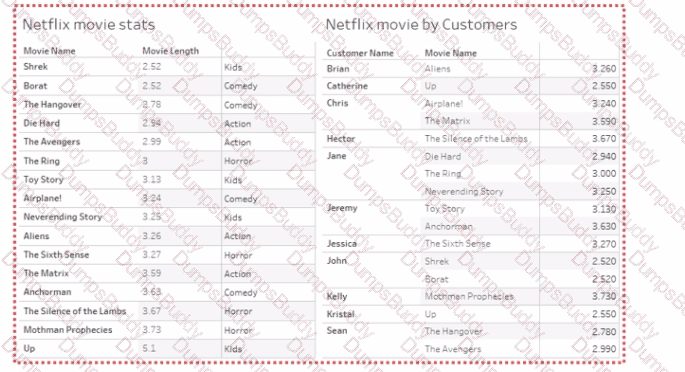
What should you do?
A Data Analyst needs to add a custom color palette to Tableau Desktop for use across multiple workbooks. The palette must reflect the company ' s branding.
What should the analyst do?
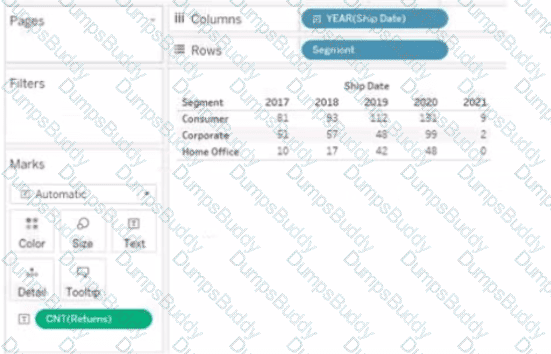
You have the following visualization.
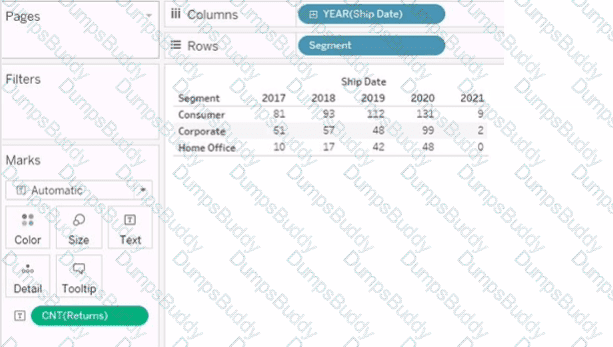
You want the count of Returns displayed only for the first year in the table.
How should you complete the formula in the calculated field? (Use the dropdowns in the Answer Area to select the correct options to complete the formula.)


You want to connect a Tableau workbook to a dataset in a Microsoft Excel spreadsheet.
What should you do from Tableau Desktop?
You have the following line chart that shows the average sales by month.
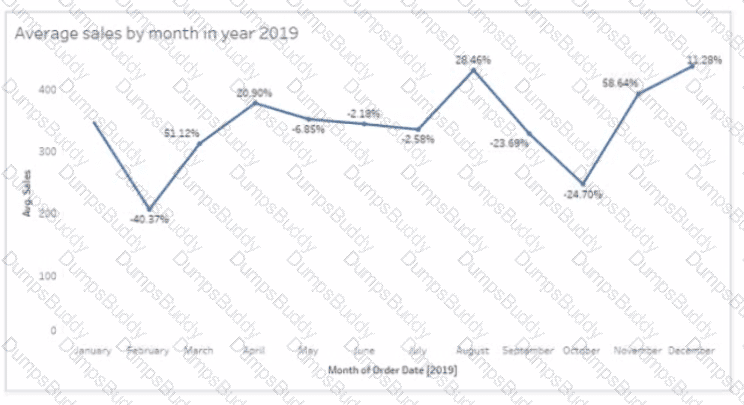
Which month had the biggest increase in swage sales compared to me previous month in 2019?
You have a Tableau workbook that contain three worksheets named Sheet1 Sheet2 and Sheet3.
You create several filters.
From the Data Source page you plan to add data source fillers
When type of filter will appear in the Edit Data Source Filters dialog box?


You have the following dataset.
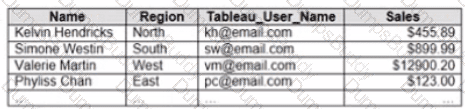
You plan to create a dashboard that will be filtered to show only data that is relevant to a specific Tableau user based on the Tableau_User_Name field You need to create a boolean calculated field to place on the data source finer Which formula should you use for the filter?
Which function should a Data Analyst use to average sales at a less-granular level of detail than is in the view?
A Data Analyst is creating a new data source made up of multiple tables and decides to use relationships during the creation process.
What is the advantage of using a relationship?
In a dataset, a Data Analyst has a string field named Category that contains unnecessary trailing spaces.
Which function should the analyst use to remove the trailing spaces from the Category field?
A Data Analyst needs to analyze the financial performance of the sales team. In order to make the dashboards easier to understand, the analyst needs to format the financial values to show the dollar symbol ($) in front of the value.
How should the analyst enable this formatting across the workbook?
You have a dataset that contains people and the awards they have won.
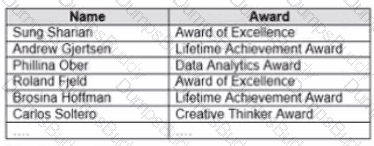
Which formula should you use to get the number of different types of awards that have been won?
You have the following dataset.

You need to generate the results in the Day field.
How should you complete the formula? (Use the dropdowns in the Answer Area to select the correct options to complete the formula.)


A colleague provides a Data Analyst with access to a folder that contains the following files:
Sales.csv
Book1.twb
Sales.hyper
Export.mdb
Which file is a Tableau extract?
You publish a dashboard tut uses an attract. The extract refreshes every Monday at 10:00.
You need to ensure that the extract also refreshes on the last day of the month at 18:00.
What should you do?
in which three formats can you export a worksheet from the Worksheet menu? Choose three
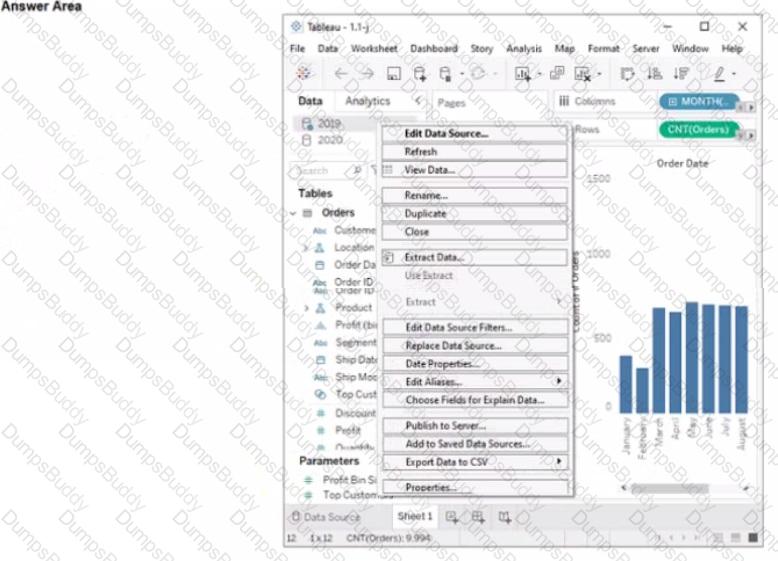
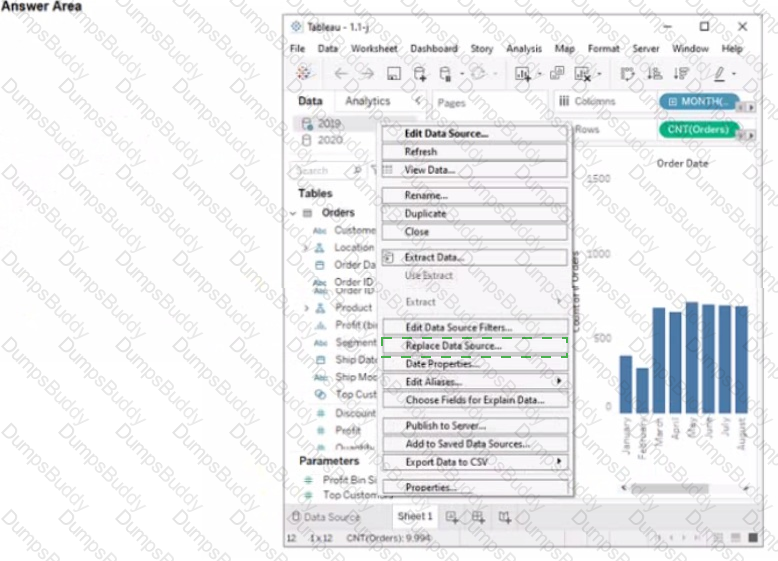
You have two data sources that use the same schema One data source contains order data from 2019 and the other data source contains order data from 2020.
You have a worksheet that shows the orders from 2019.
You need to configure the worksheet to show the orders from 2020 without reloading the data.
Which option should you select?
PDF + Testing Engine

Testing Engine
PDF (Q&A)