Applied-Algebra WGU Applied Algebra FXO2 PFXP C957 Questions and Answers
The graph shows the number of customers, C(t), showing up to a store, where the number of hours since opening is along the horizontal axis and the number of customers showing up to the store each hour is along the vertical axis.
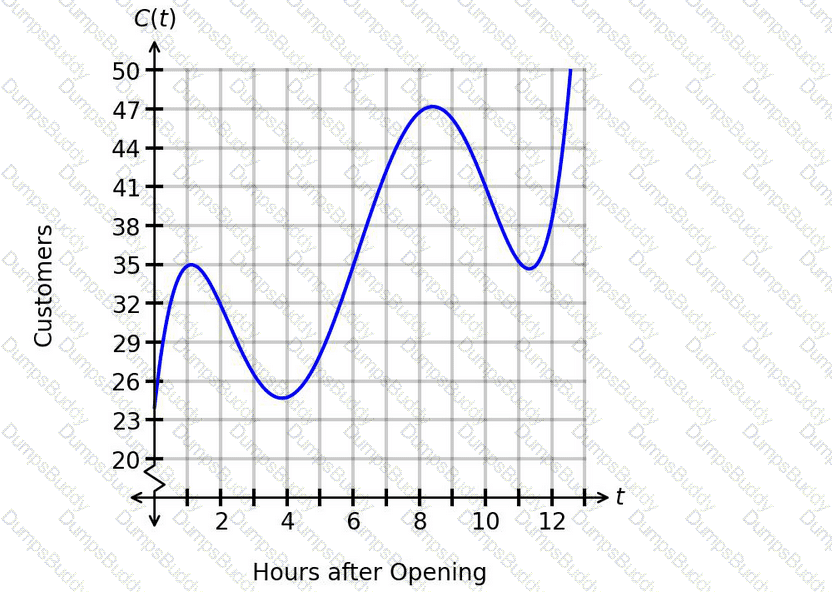
How can the concavity be described from t=6.2to t=10.1?
A researcher collected data on the number of members in a national association over time. The results are shown in the scatterplot. The graphed regression function has an r^2value of 0.54.
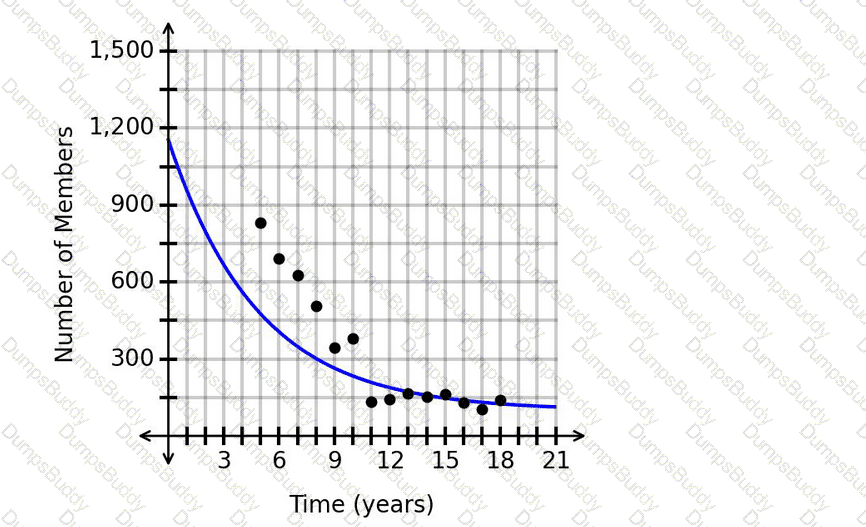
Is it appropriate to make a prediction for the number of members after 20.6years?
The number of new user accounts per day on a website is modeled by a decreasing exponential function. The graph of the function is shown.
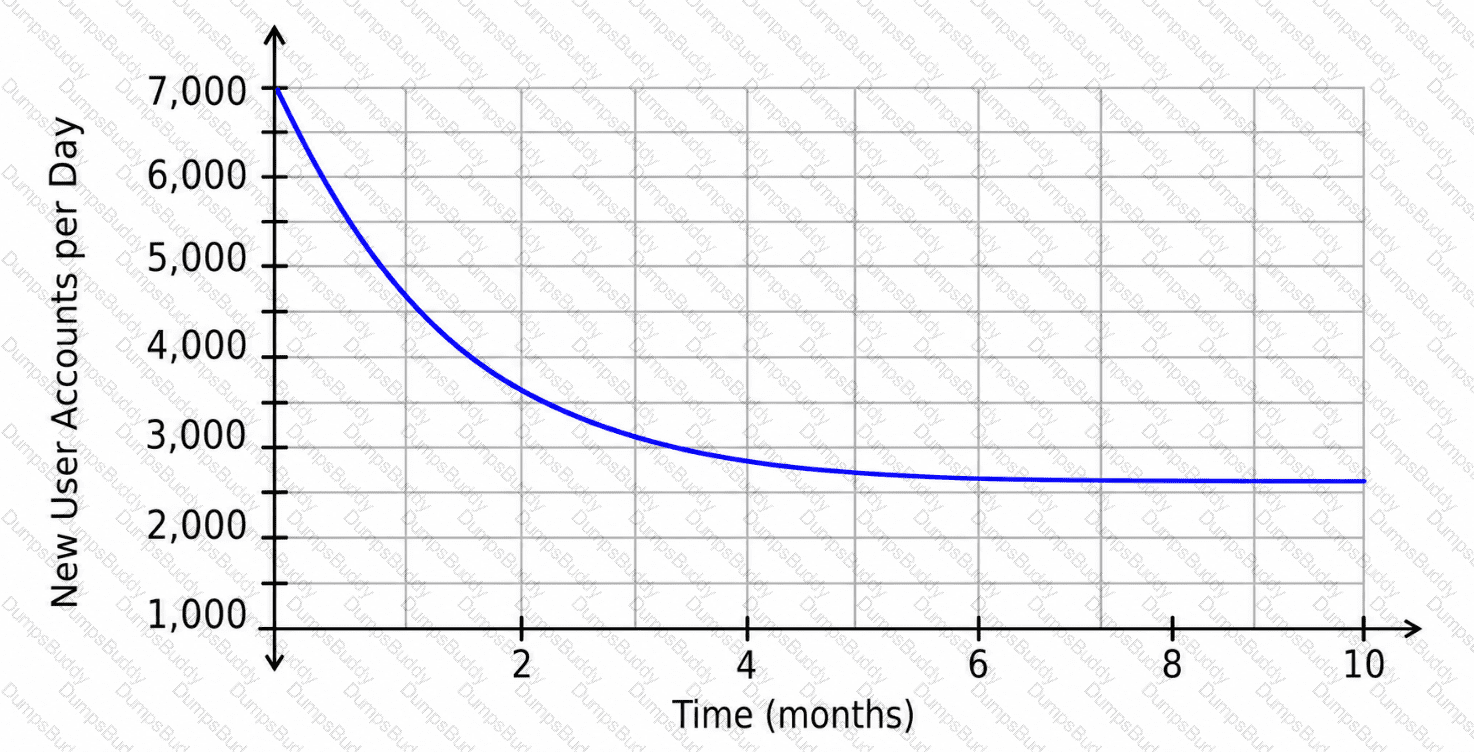
Which statement is justified considering the location of the horizontal asymptote?
The value of a collectible artifact is represented by the function
f(x)=330× 〖 1.15 〗 ^x
In this function, xrepresents the number of years since 2005, and f(x)represents the value of the artifact, in dollars.
Which value represents the average yearly rate of change of the value of the artifact from 2006 to 2011?
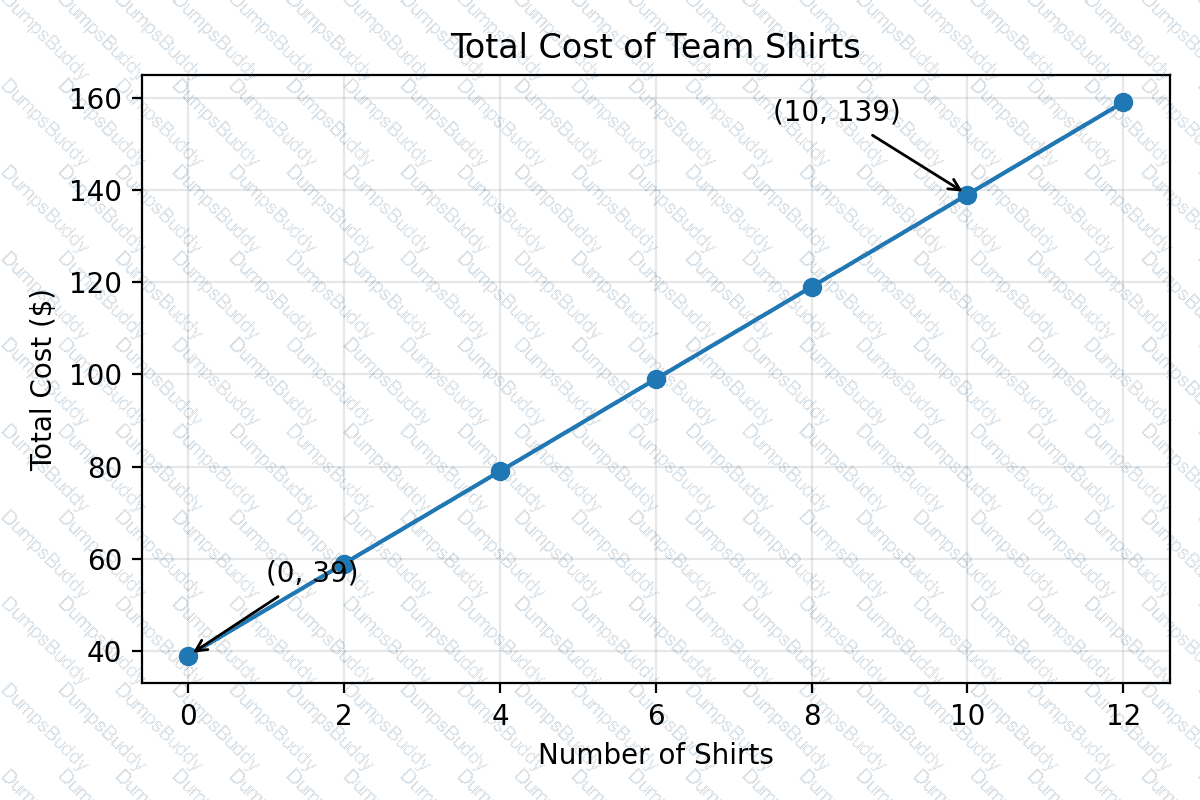
A coach is placing an order for team shirts. The graph shows the total cost based on the number of shirts. What is the cost of each additional shirt?
Exhibit:
The graph shows the daily practice duration for a musician, where the number of days since the beginning of the month is along the horizontal axis and the number of minutes practiced per day is along the vertical axis.
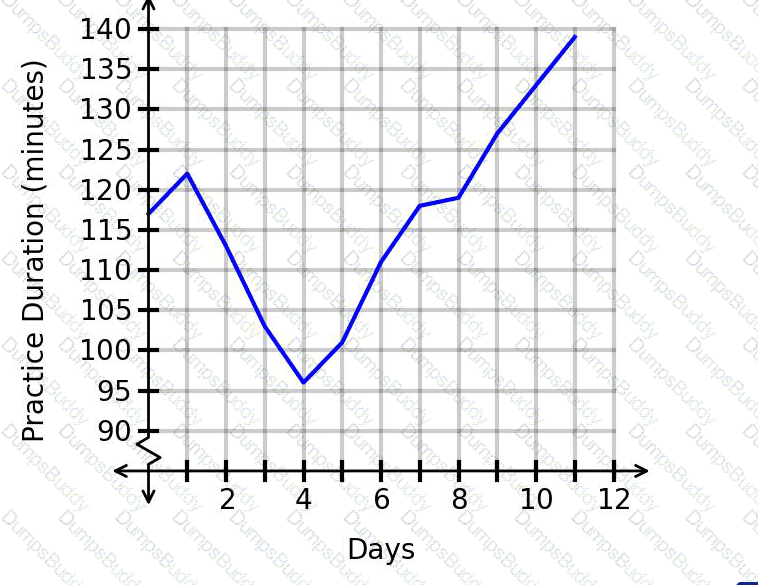
What was the practice duration for day 9, based on the graph?
Based on collected data, the number of employees at a firm can be modeled using the function
f(x)=10× 〖 1.09 〗 ^x
whose graph is shown, where xrepresents the number of years since 2001 and f(x)represents the number of employees, in thousands.
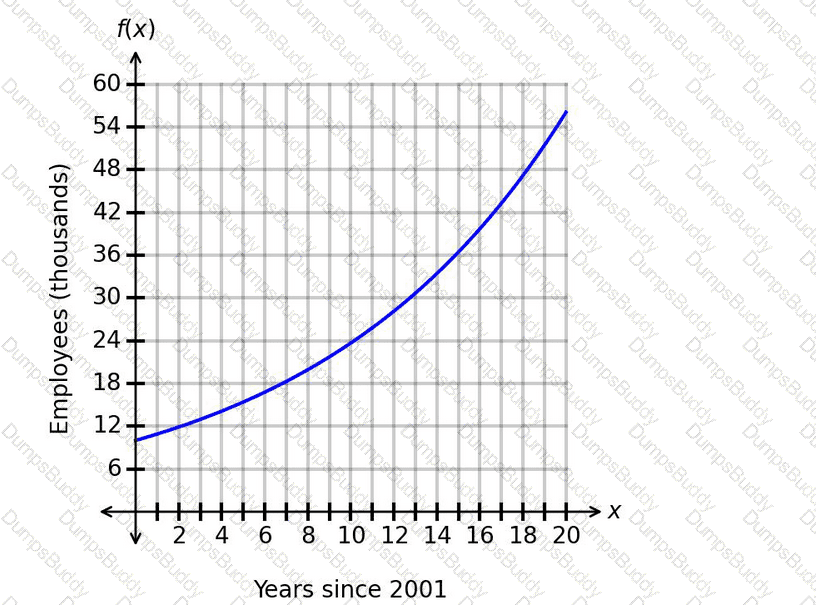
Which time period has the fastest average increase in the number of employees?
The temperature of an object changes according to the relationship in the graph.
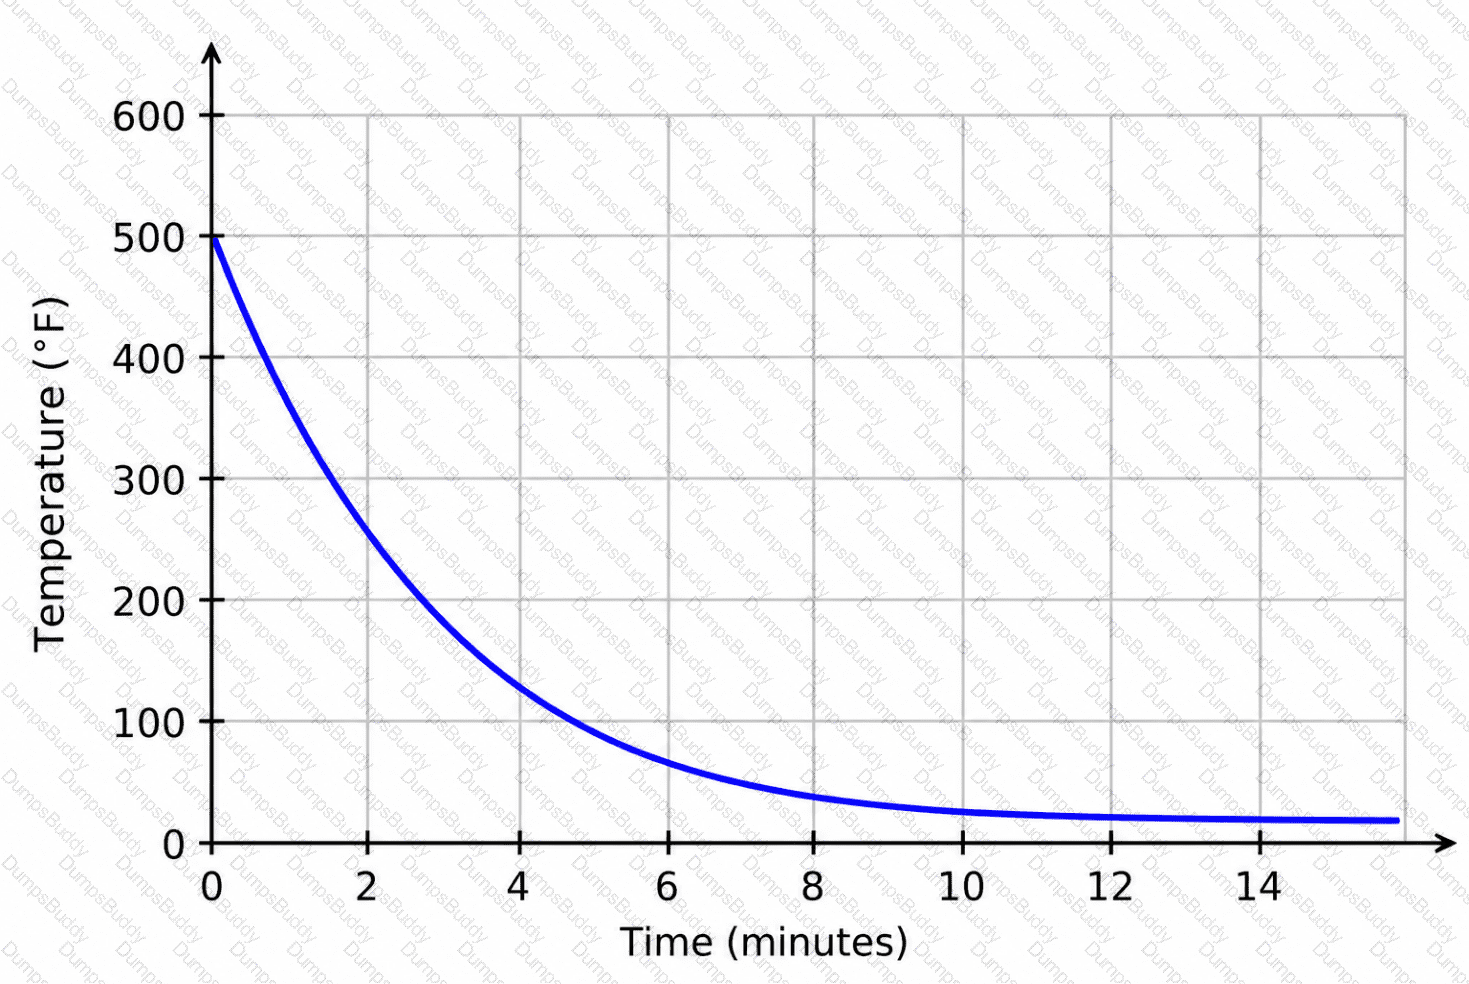
Which equation represents the horizontal asymptote of the function?
The logistic function f(x), whose graph is shown, models the number of registrants for an academic conference, where xrepresents the number of weeks since registration opened and f(x)represents the number of registrants.
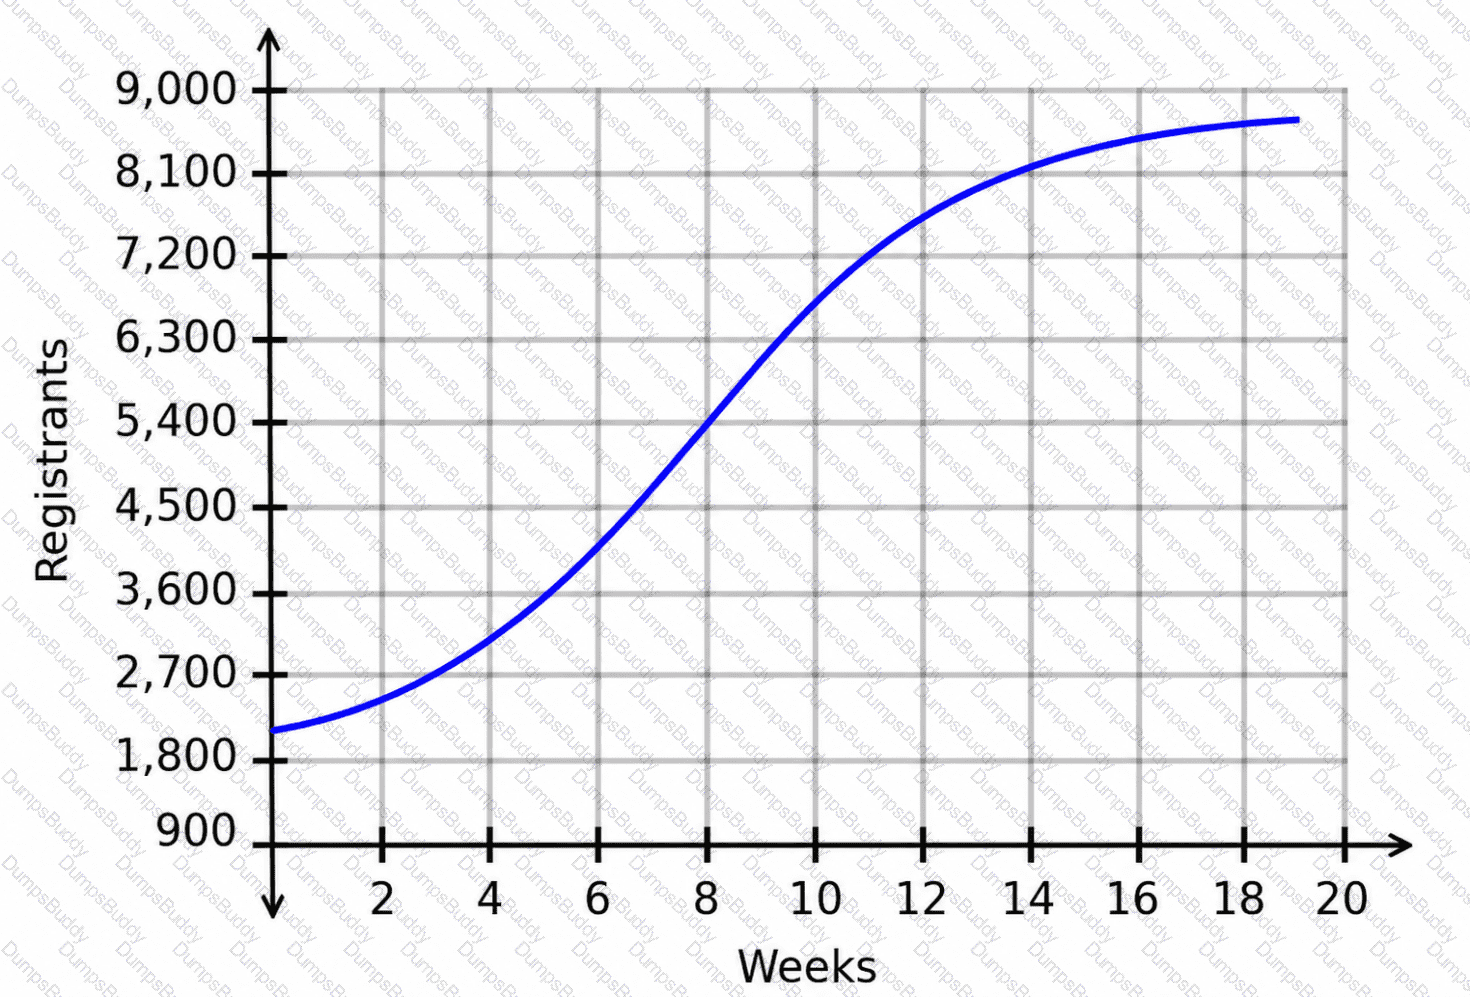
How does the number of registrants change as time progresses from week 1 to week 7?
The graph shows the value, O, in dollars, of an investment account over time.
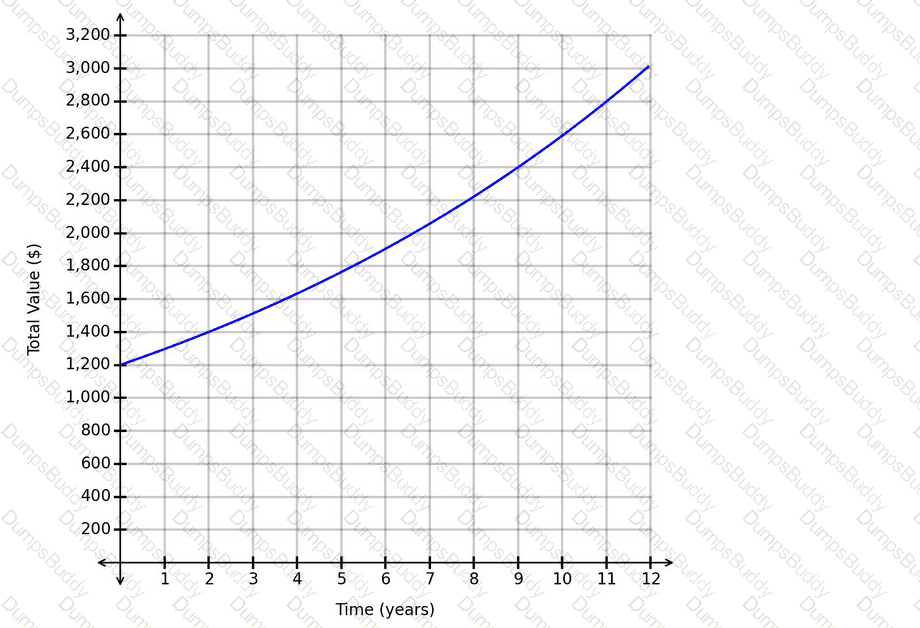
What represents the value of the account after 8 years?
The graph shows the progress of a manufacturing team, modeling the number of widgets the team is able to produce each day since the team was formed.
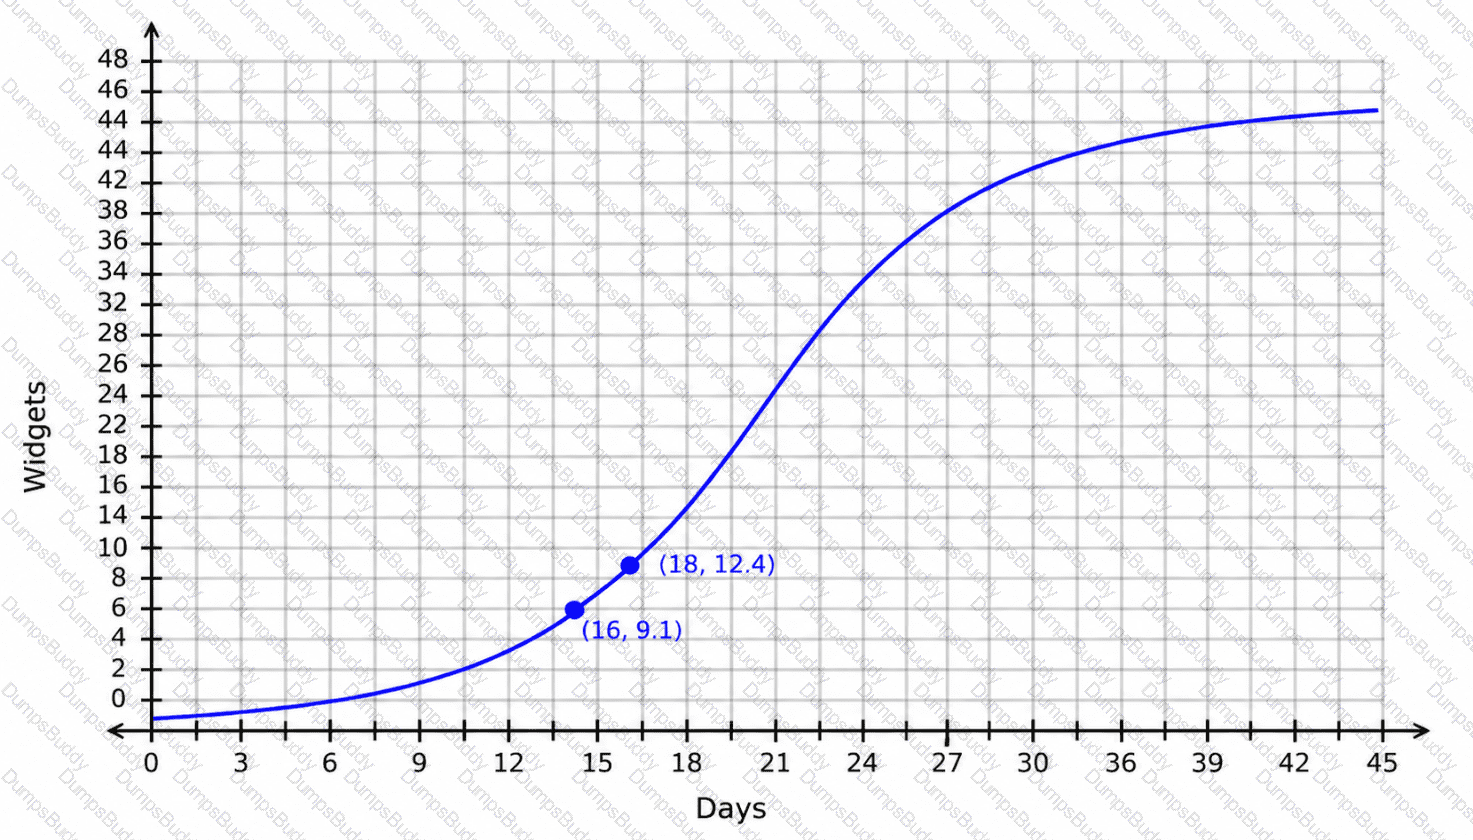
How should the average rate of change from day 16 to day 18 be interpreted?
The function d(x)=14+65xrepresents the distance, in meters, from a tower to an object at time x, in seconds.
What is the value of d(1.5)?
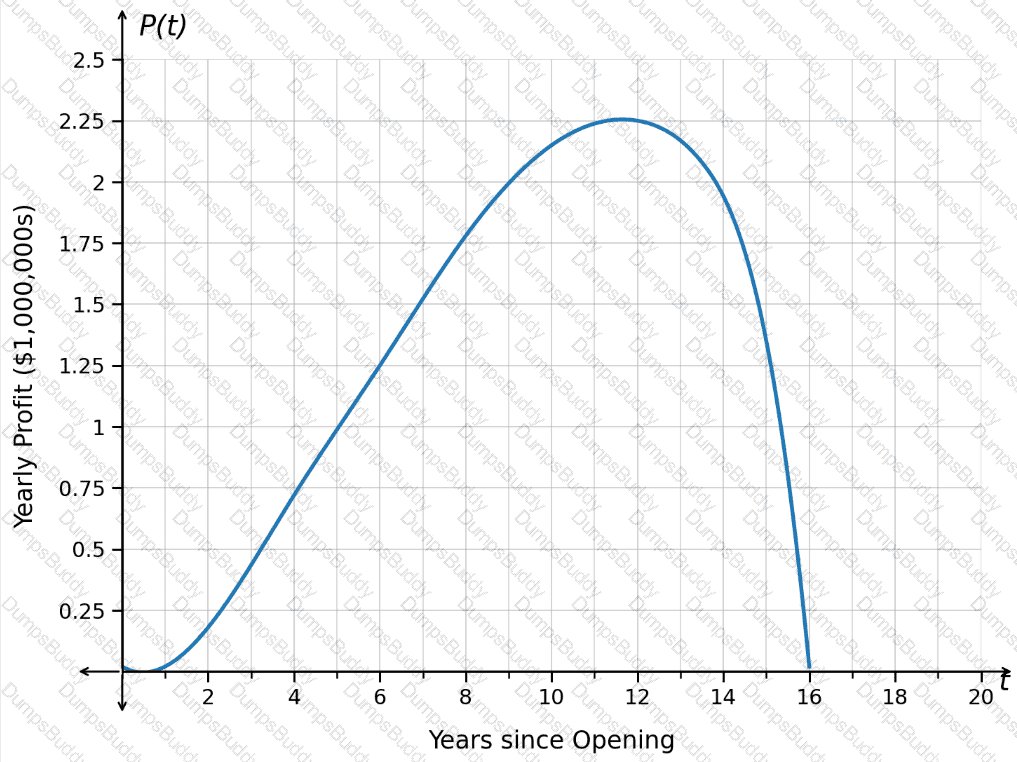
The function P(t) represents the yearly profit, in thousands of dollars, for a virtual store since opening. The graph of P(t) is shown.
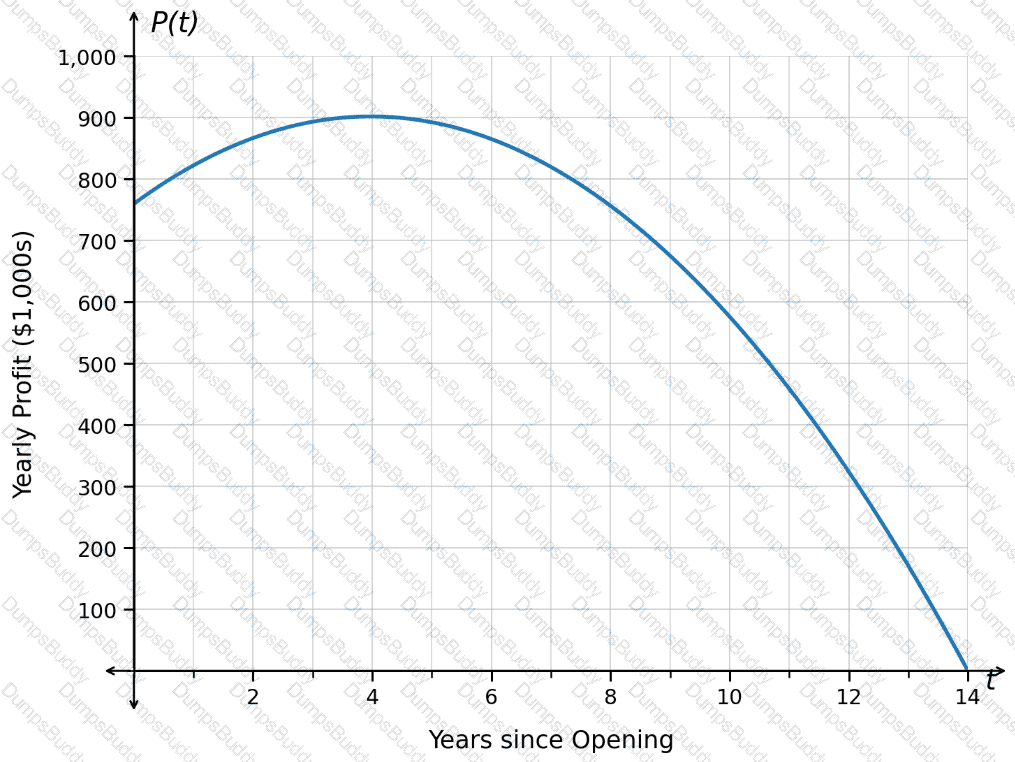
What is the time at which the store reached the maximum yearly profit?
A new company just launched and is using the function M(t) to predict its market share after t years. The graph of M(t) is shown.
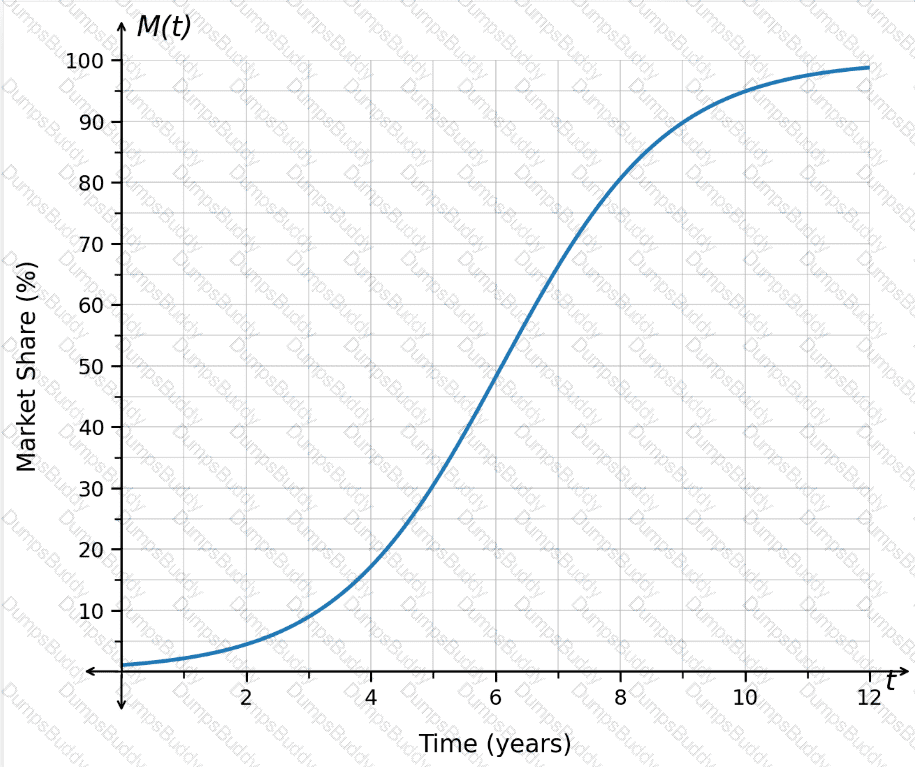
When should the company expect to have a market share of 60%?
The graph shows the weekly profit in hundreds of dollars for a coffee shop. The horizontal axis represents the number of years since the coffee shop opened.
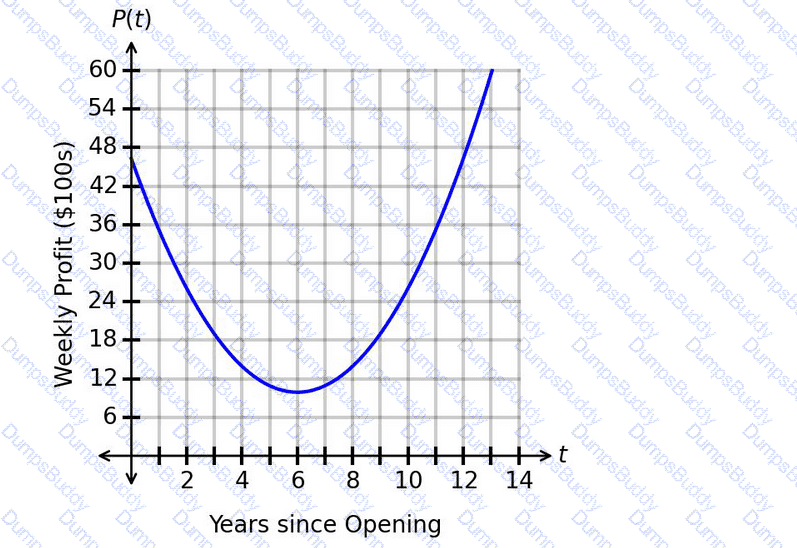
What is the correct interpretation of the minimum value?
The growth of an animal population is shown in the graph. The instantaneous rate of change at point Pis 3.74.
Which interpretation of the instantaneous rate of change is correct?
A small business is tracking the number of client accounts it manages over time. The graph shows the relationship between time and the number of client accounts the small business manages.
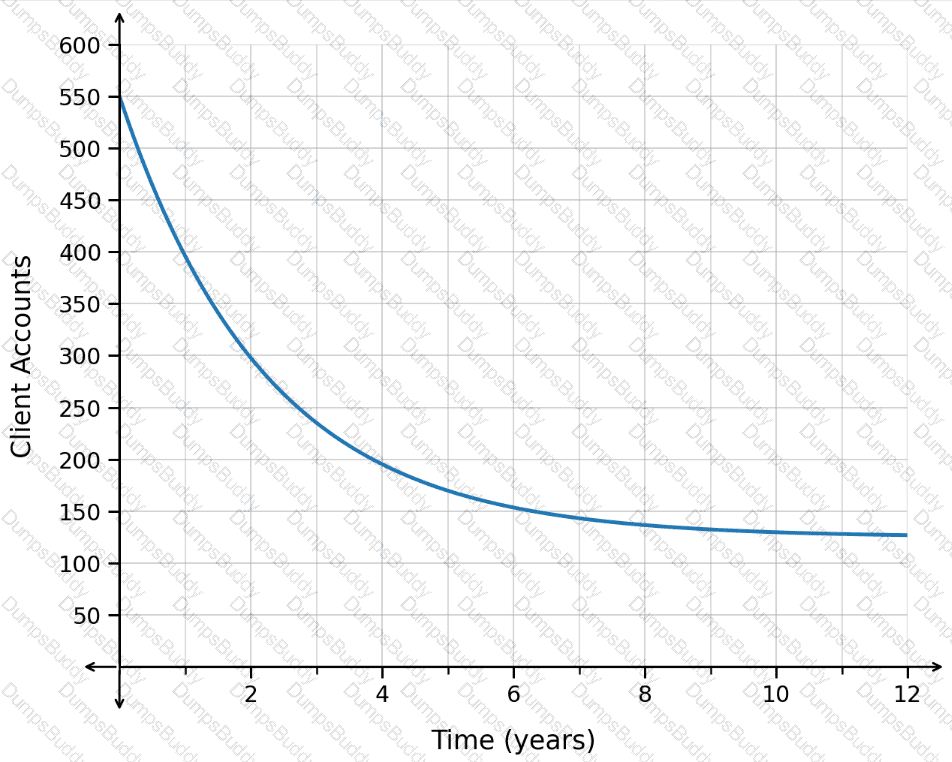
What is the equation of the horizontal asymptote?
In the following graph showing the elevation profile, F(d), for a mountain biking course, the horizontal axis shows the number of miles since the start of the course and the vertical axis shows the elevation in feet.
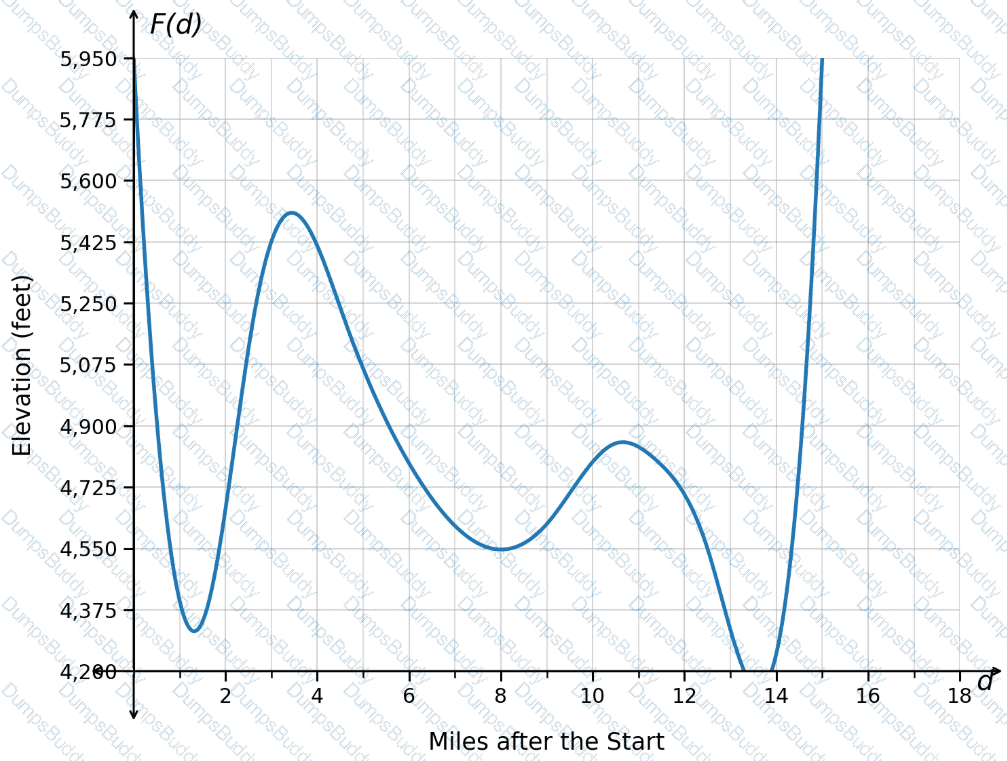
How can the concavity be described from d=10 to d=13.1?
The graph shows the number of customers visiting a bookstore, where the number of days since the beginning of the month is along the horizontal axis and the number of customers visiting the bookstore each day is along the vertical axis. More customers show up to the store on days when new releases are featured than on other days.
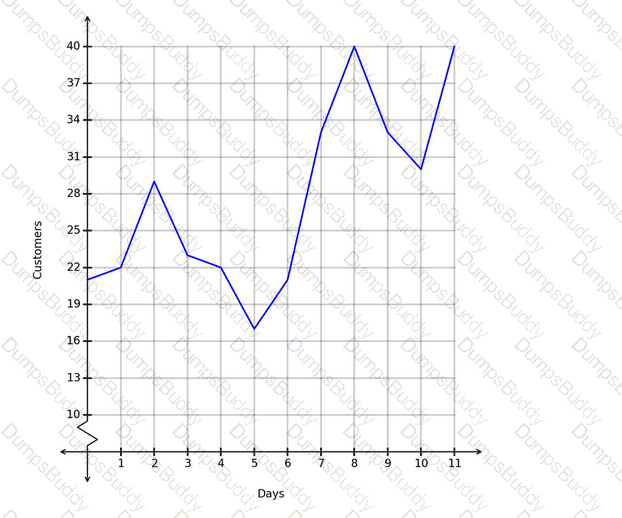
Which days likely featured new releases?
The logistic function f(x), whose graph is shown, models the number of people with a viral infection, where x represents the number of days since the outbreak of the virus and f(x) represents the number of viral infections.
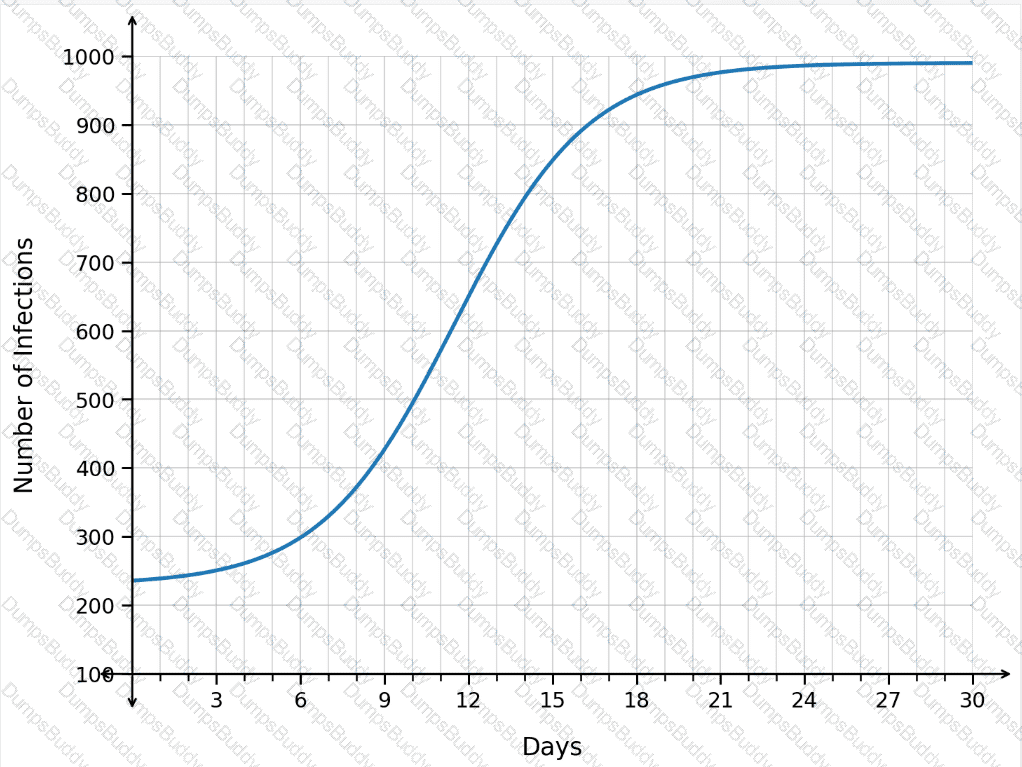
What happens as time progresses from day 9 to day 12?
The logistic function f(x), whose graph is shown, models the number of registrants for an academic conference, where x represents the number of weeks since registration opened and f(x) represents the number of registrants.
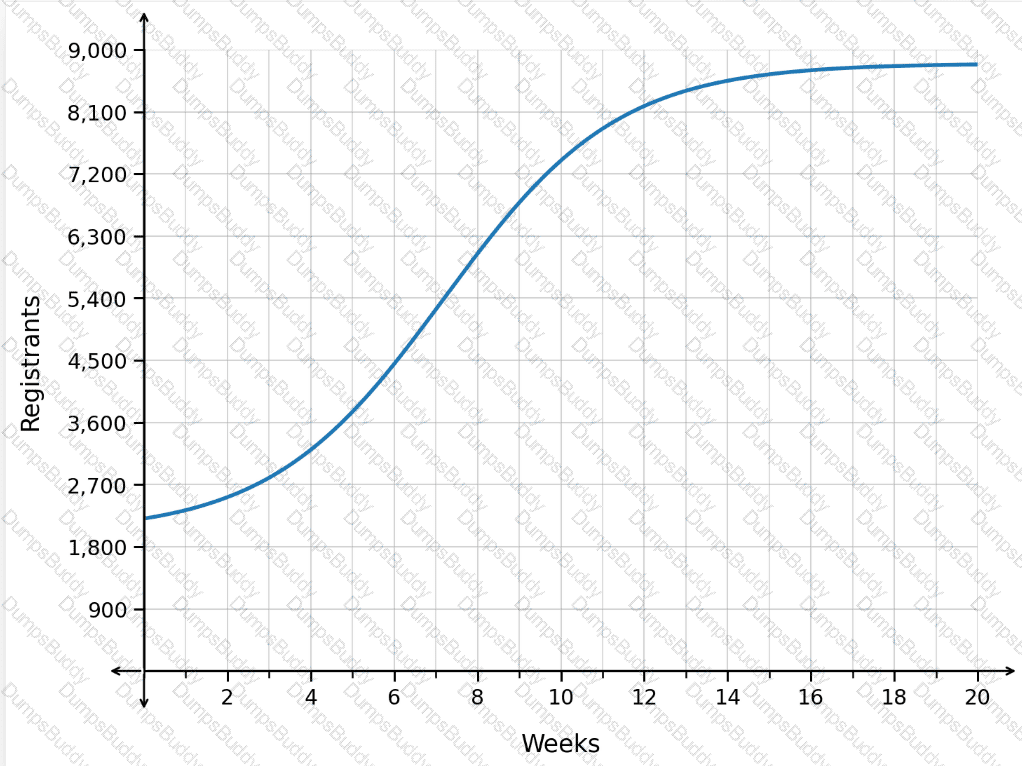
How does the number of registrants change as time progresses from week 1 to week 7?
The function P(t) represents the yearly profit, in millions of dollars, for a clothing store since opening. The graph of P(t) is shown.
How should the maximum value be interpreted?
A person makes down quilts to sell.
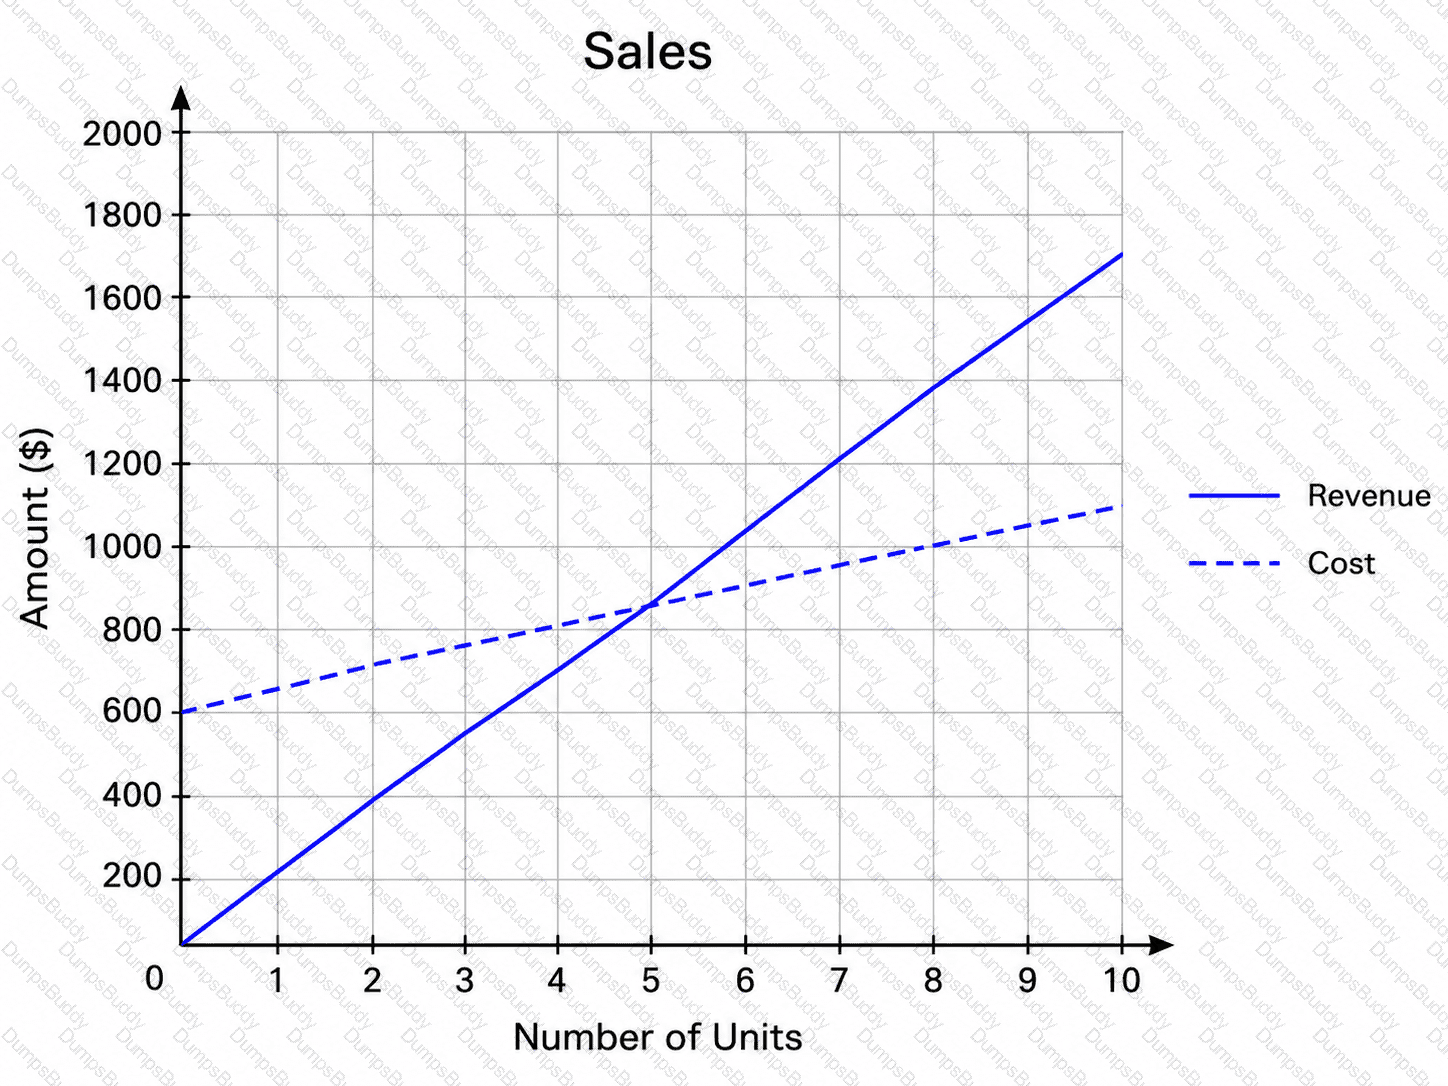
The graph shows the functions that model the cost and revenue.
How many down quilts need to sell to break even/start making a profit?
The function P(t)represents the weekly profit, in thousands of dollars, for a rental store since opening. The graph of P(t)is shown.
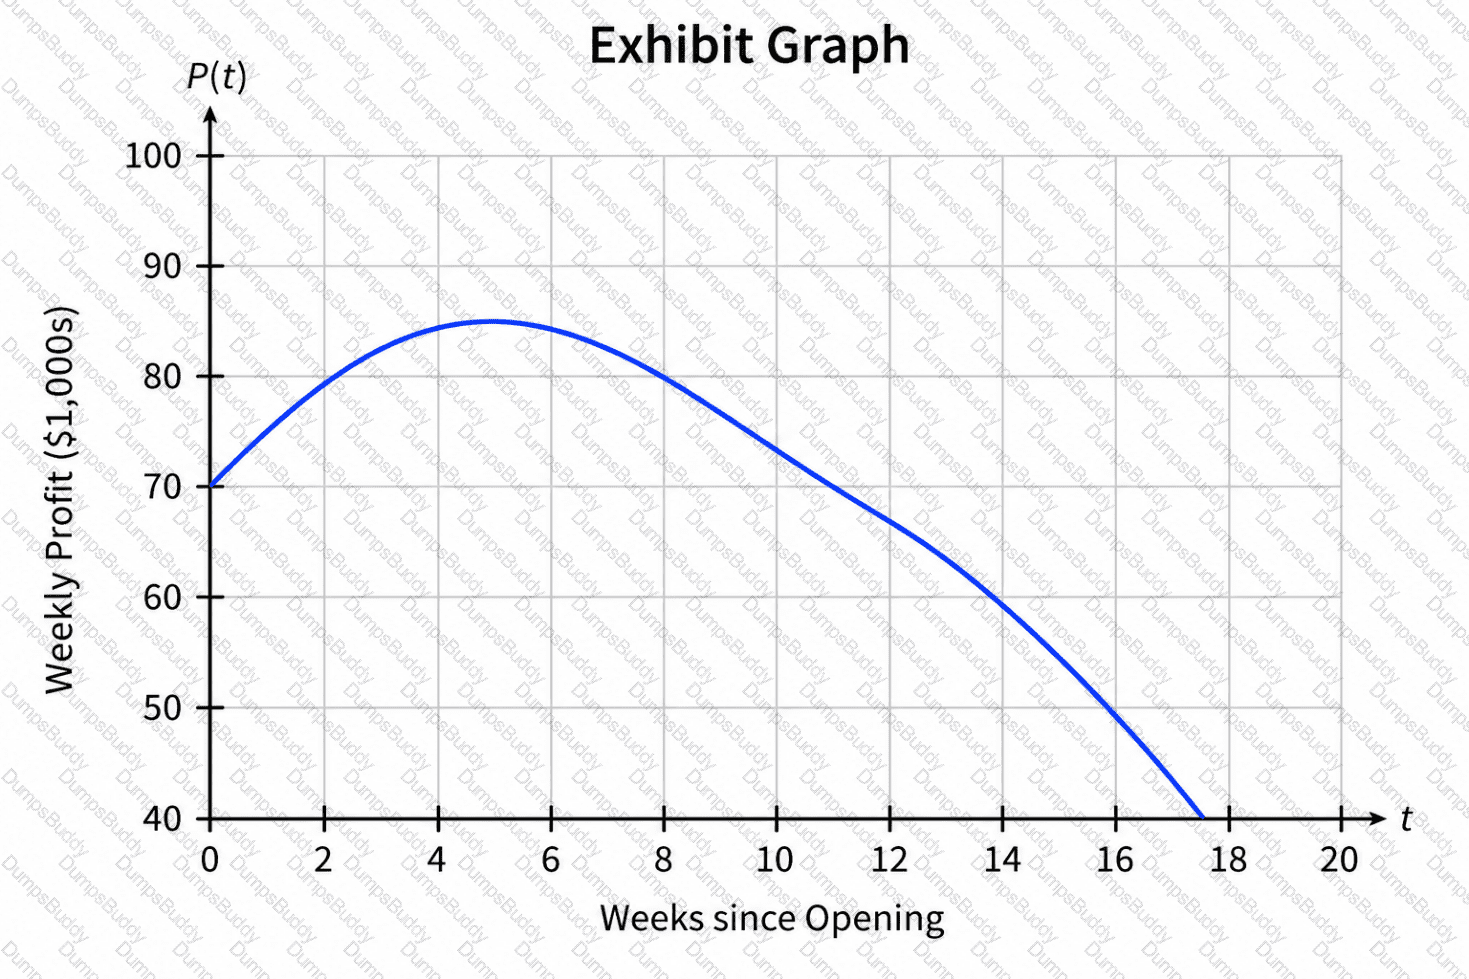
When did the store have its maximum weekly profit?
The function P(t)represents the daily profit, in hundreds of dollars, for a hardware store since opening. The graph of P(t)is shown.
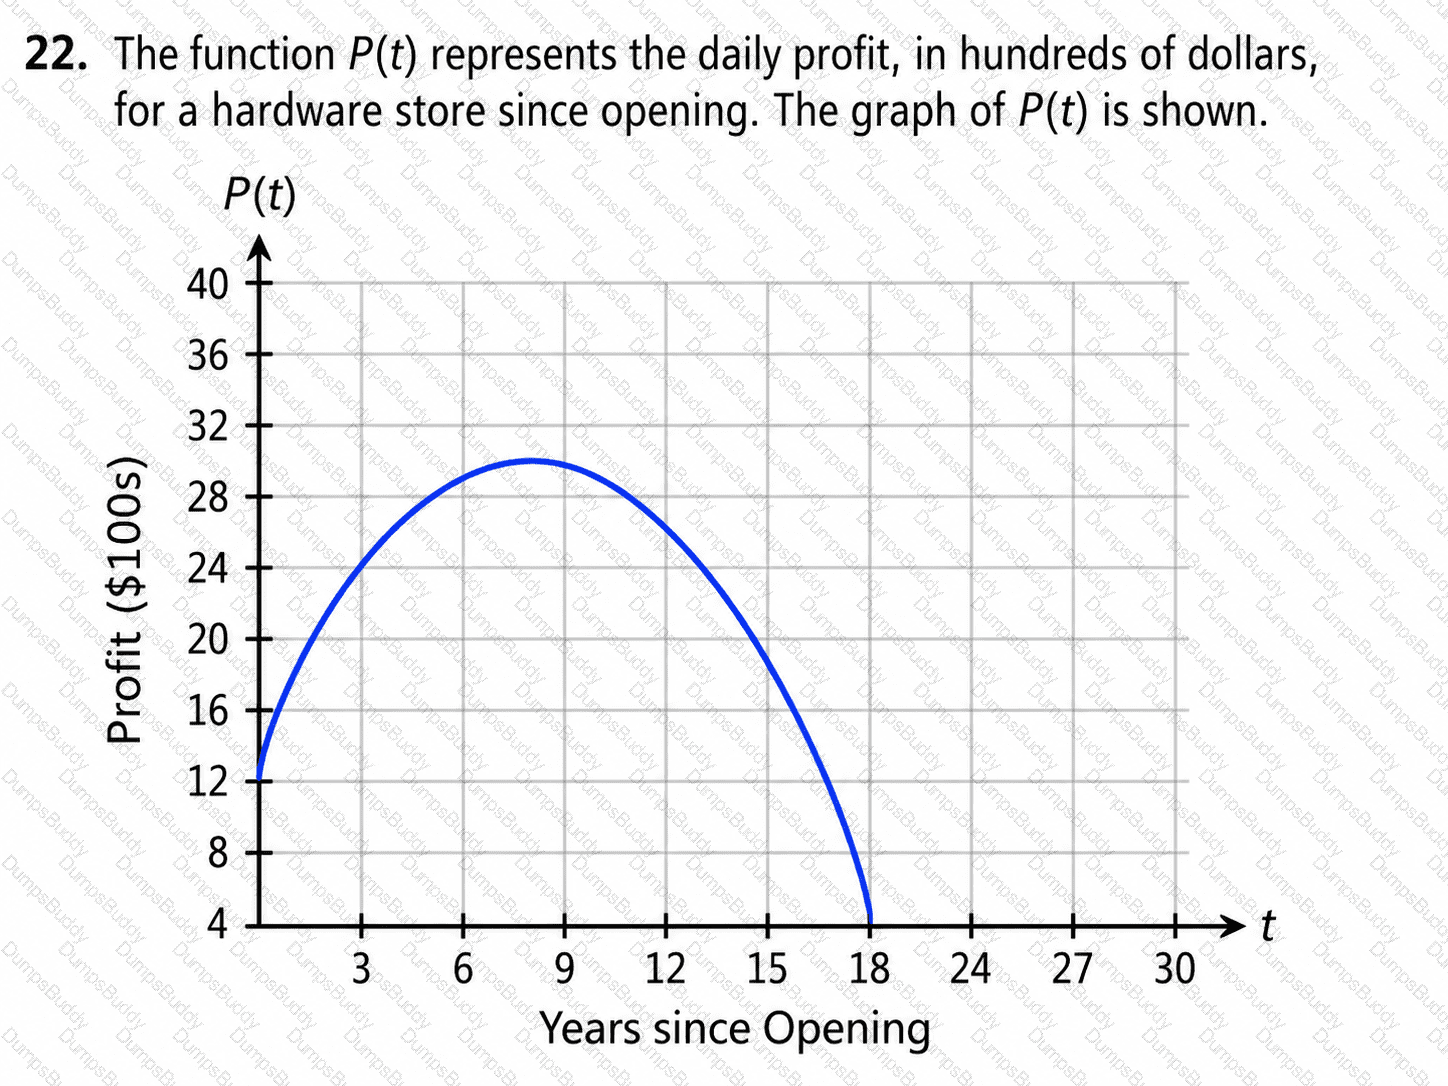
How should the maximum value be interpreted?
The function f(n) represents the relationship between the distances traveled by two vehicles, where n is the distance traveled by vehicle A and f is the distance traveled by vehicle B. The distance traveled by vehicle B is 17 more than the distance traveled by vehicle A.
Which function represents this situation?
The number of letters processed daily at a mail center is modeled by the decreasing exponential function shown in the graph.
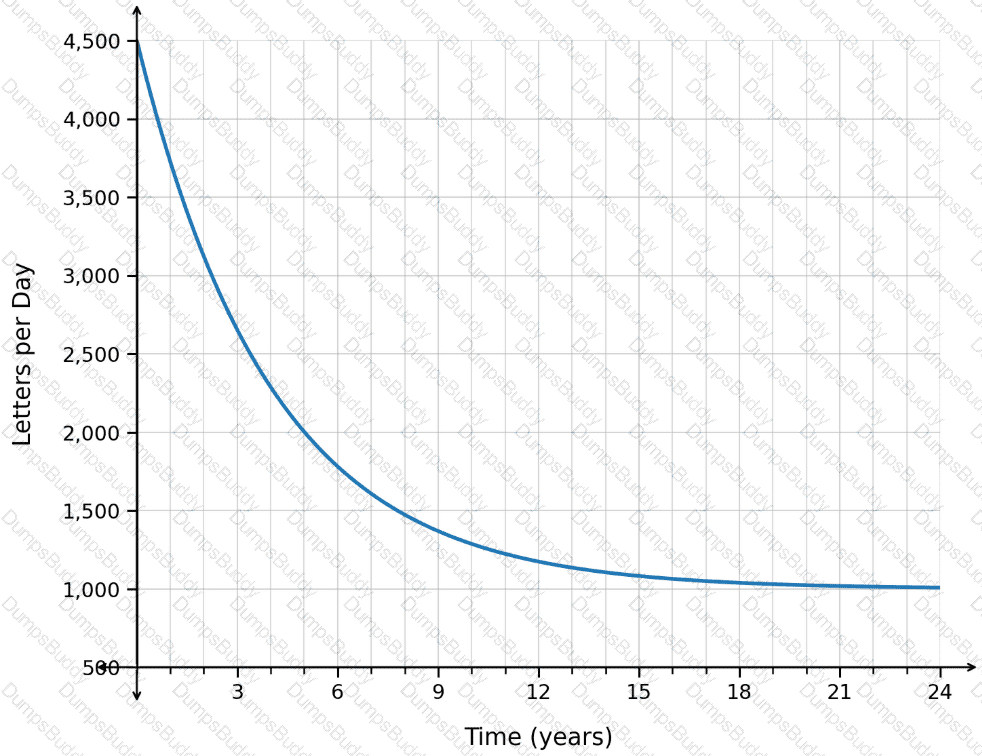
What is the long-term trend in the number of letters processed per day, based on the equation of the horizontal asymptote?
Based on collected data, the value of a painting can be modeled using the exponential function f(x)=240(1.12)
x
. In this case, x represents the number of years since 2005, and f(x) represents the value of the painting in dollars.
Which value represents the average yearly rate of change of the painting’s value from 2013 to 2015?
A coach is placing an order for team shirts. The graph shows the total cost based on the number of shirts.
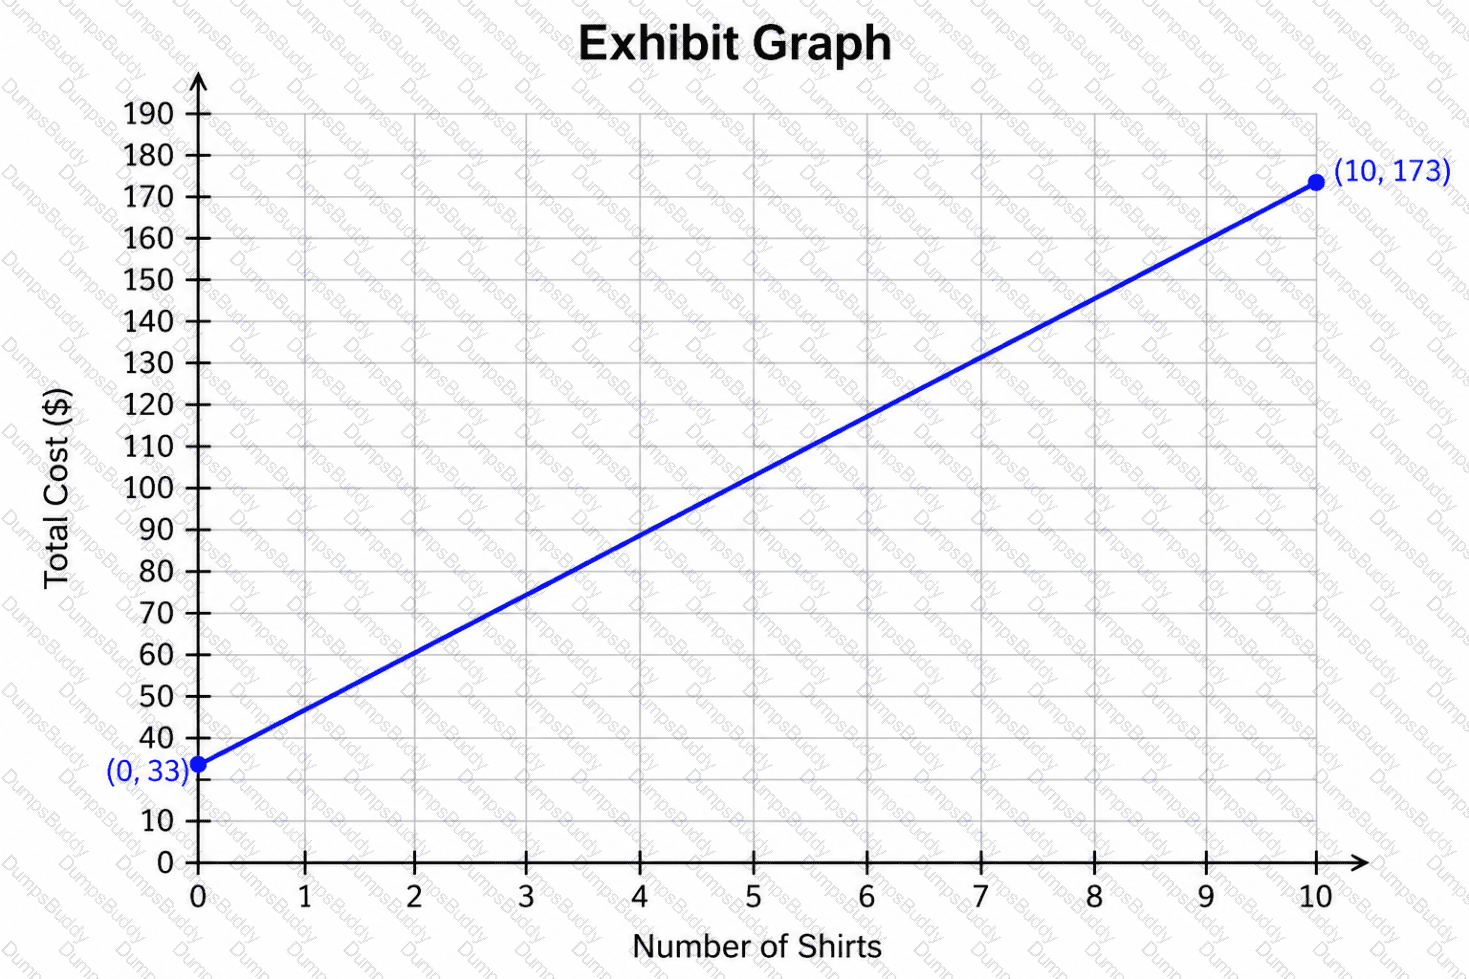
What is the cost of each additional shirt?
The populations, in thousands, of two towns are shown in the graph, where the horizontal axis measures the time in years.
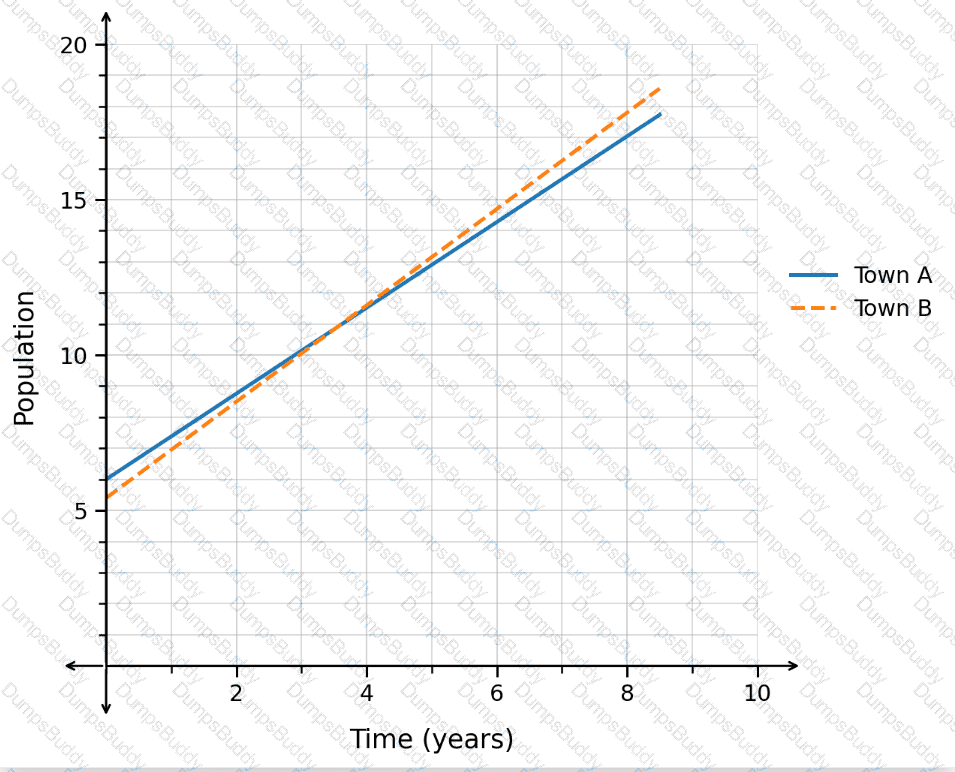
Which town’s population is growing at a faster rate?
The graph shows the number of user accounts on a social media website over time.
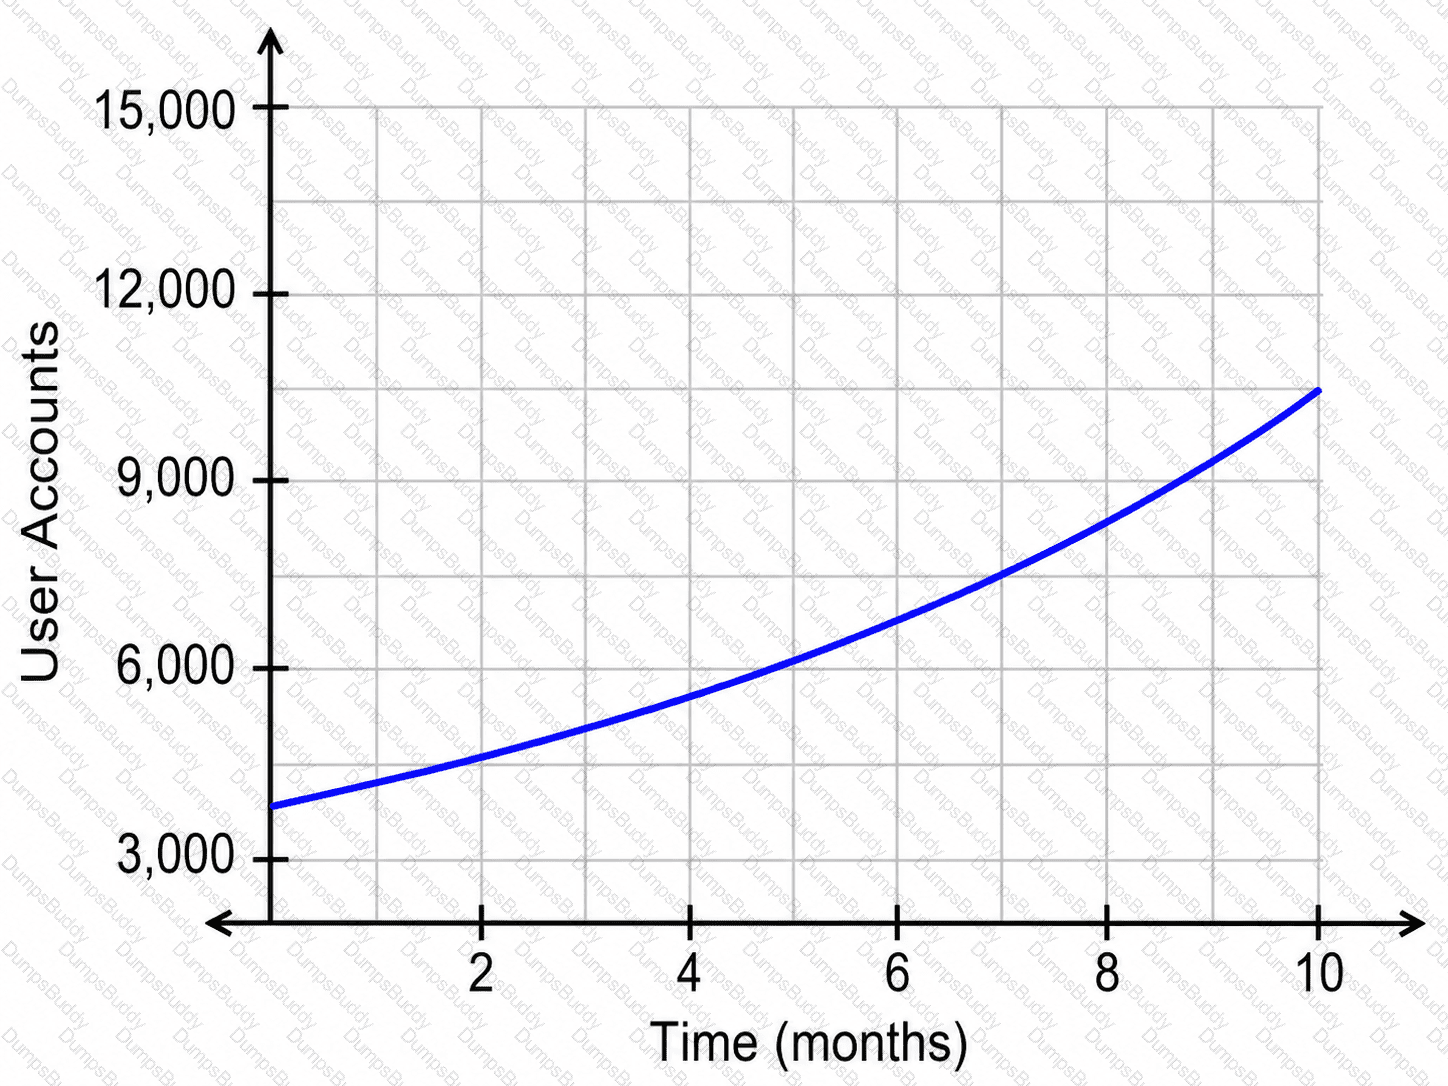
When did the number of user accounts reach 4,500?
The figure shows the graph of x(t), which represents the number of users, x, watching a live video thours after 9:00 a.m.
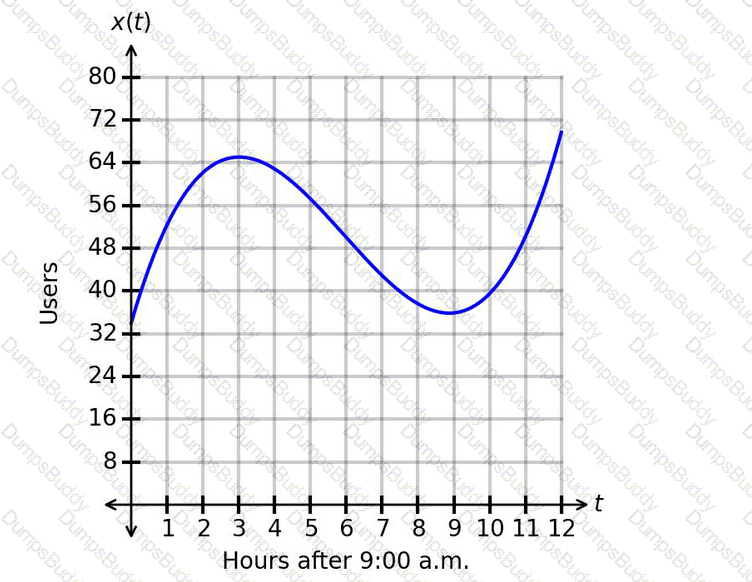
Which interpretation of the concavity between t=3.2and t=5.7is correct?
An exponential growth function can be used to model the number of bacteria in a population. The function
G(t)=1,600× 〖 1.31 〗 ^t
is the model, with Grepresenting the number of bacteria cells and trepresenting the time in minutes.
What is the size of the population after 25 minutes?
Which statement correctly interprets u(8), given that u(t)=0.21t
3
−4.09t
2
+18.89t+69.5 represents the number of units, u, in an inventory warehouse t hours after 9:00 a.m.?
A cart is being loaded with boxes, and each box has the same weight. After 4 boxes are loaded, the total weight of the boxes and cart is 116 pounds. After 9 boxes are loaded, the total weight is 161 pounds.
What is the weight of each box?
The function N(t)models the number of subscribers to a virtual newsletter over time. The graph of N(t)is shown. The horizontal axis represents the number of years since the newsletter started, and the vertical axis represents the number of subscribers, in thousands.
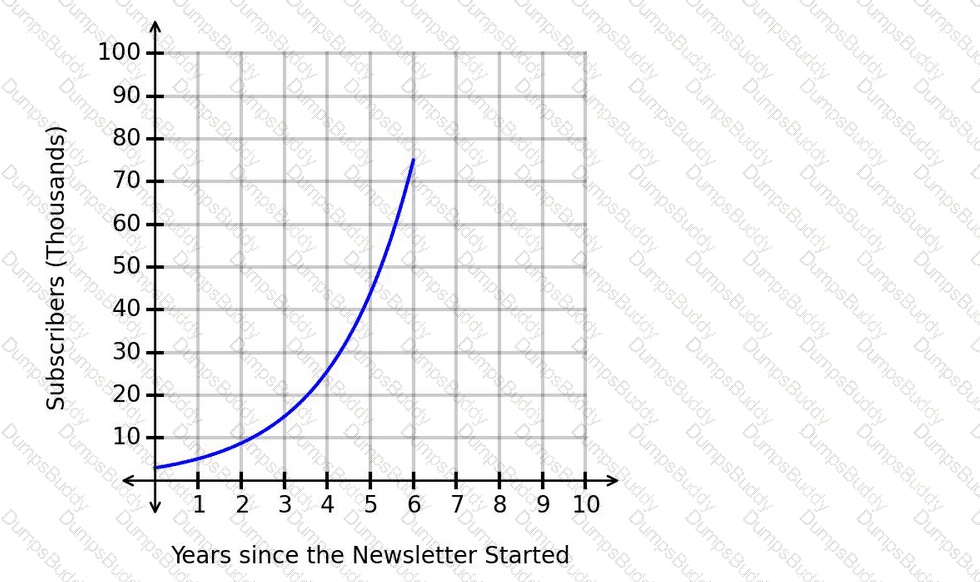
How is the number of subscribers changing over time based on the graph?
The graphed function n(t)represents the number of people, n, at a park thours after 8:00 a.m. The plotted points Aand Bhave coordinates (2│110)and (6│182).
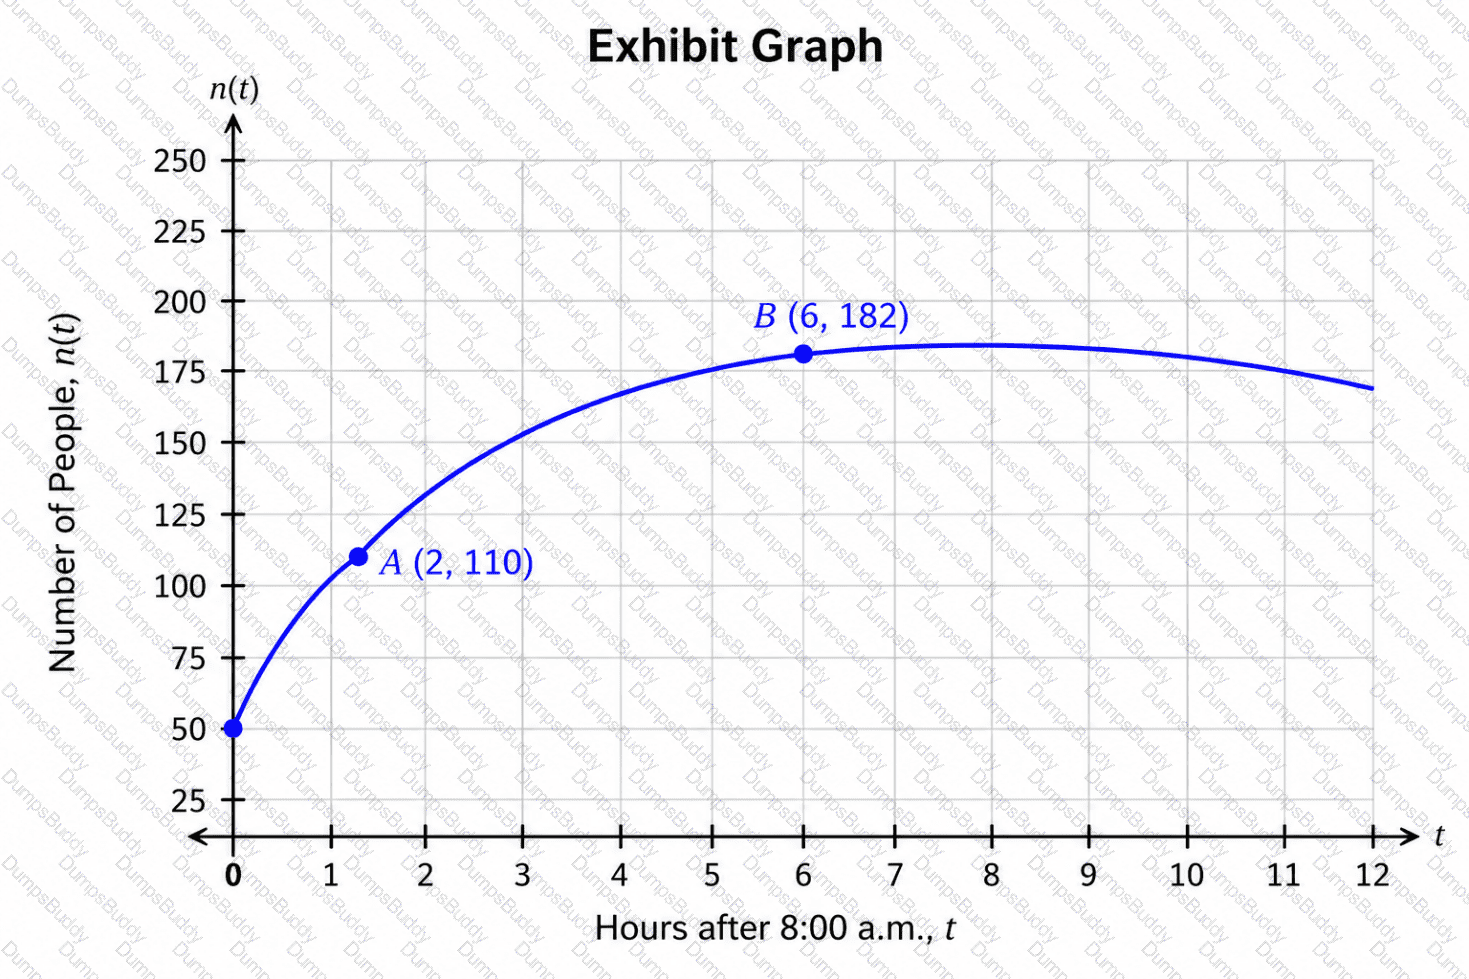
Which statement gives the correct interpretation of the average rate of change of the number of people over the interval from point Ato point B?
The exponential function
f(t)=2900(1.13)
t
represents the size of a bacteria population, where t is the time in hours.
How many bacteria are in the population when t=18?
In the graph showing the number of daily homework problems assigned for a math class, the horizontal axis shows the number of school days since the beginning of the term and the vertical axis shows the number of daily homework problems.
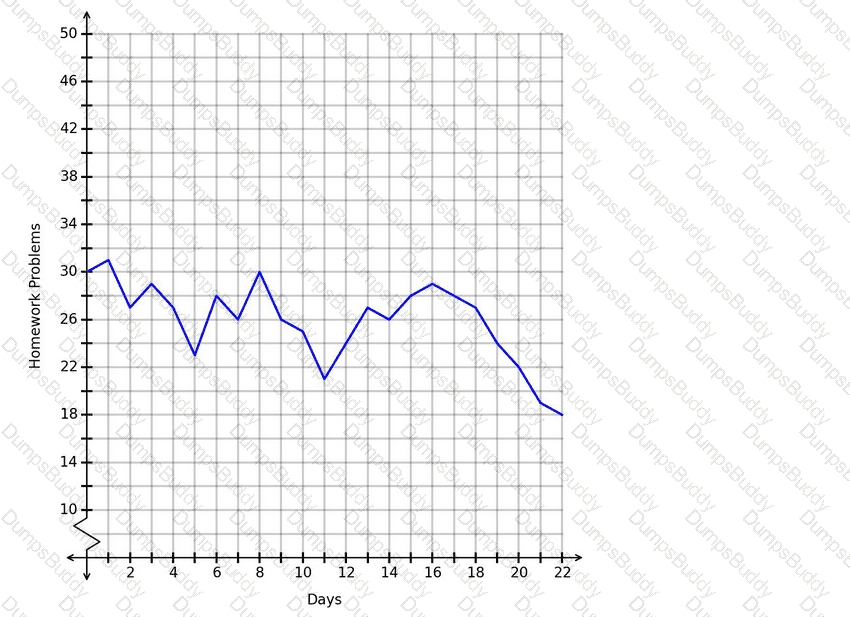
Which conclusion is correct based on this graph?
PDF + Testing Engine

Testing Engine
PDF (Q&A)