Weekend Special Limited Time 65% Discount Offer - Ends in 0d 00h 00m 00s - Coupon code: netbudy65

SPLK-4001 Splunk O11y Cloud Certified Metrics User Exam Questions and Answers

Questions 4

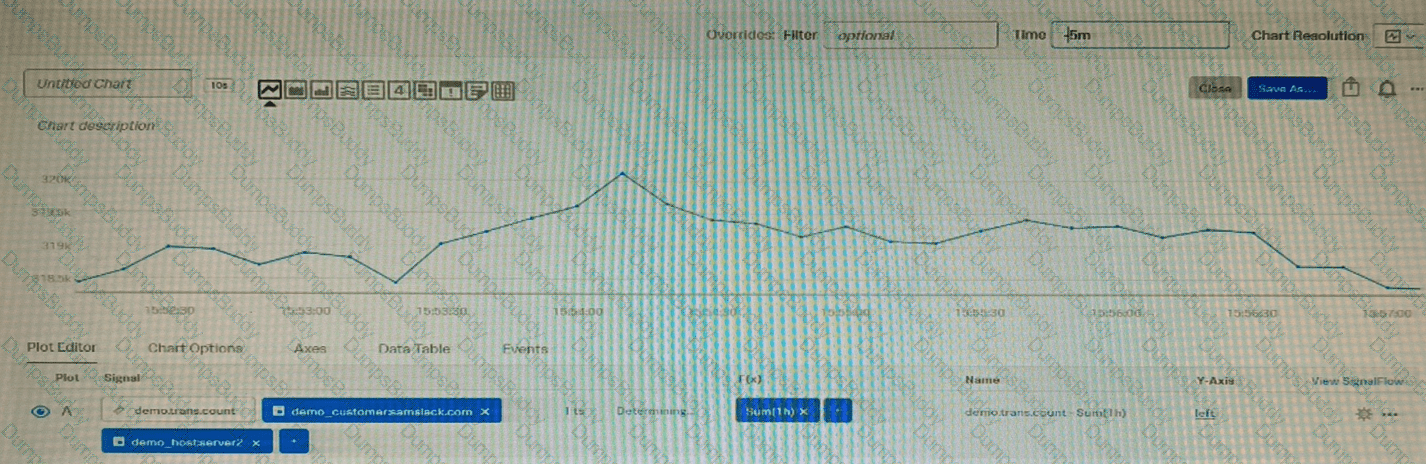
Given that the metric demo. trans. count is being sent at a 10 second native resolution, which of the following is an accurate description of the data markers displayed in the chart below?

SPLK-4001 Question 4

Options:

A.

Each data marker represents the average hourly rate of API calls.

B.

Each data marker represents the 10 second delta between counter values.

C.

Each data marker represents the average of the sum of datapoints over the last minute, averaged over the hour.

D.

Each data marker represents the sum of API calls in the hour leading up to the data marker.

Buy Now
Questions 5

The alert recipients tab specifies where notification messages should be sent when alerts are triggered or cleared. Which of the below options can be used? (select all that apply)

Options:

A.

Invoke a webhook URL.

B.

Export to CSV.

C.

Send an SMS message.

D.

Send to email addresses.

Buy Now
Questions 6

One server in a customer's data center is regularly restarting due to power supply issues. What type of dashboard could be used to view charts and create detectors for this server?

Options:

A.

Single-instance dashboard

B.

Machine dashboard

C.

Multiple-service dashboard

D.

Server dashboard

Buy Now
Questions 7

An SRE came across an existing detector that is a good starting point for a detector they want to create. They clone the detector, update the metric, and add multiple new signals. As a result of the cloned detector, which of the following is true?

Options:

A.

The new signals will be reflected in the original detector.

B.

The new signals will be reflected in the original chart.

C.

You can only monitor one of the new signals.

D.

The new signals will not be added to the original detector.

Buy Now
Questions 8

Which of the following chart visualization types are unaffected by changing the time picker on a dashboard? (select all that apply)

Options:

A.

Single Value

B.

Heatmap

C.

Line

D.

List

Buy Now
Questions 9

Which of the following can be configured when subscribing to a built-in detector?

Options:

A.

Alerts on team landing page.

B.

Alerts on a dashboard.

C.

Outbound notifications.

D.

Links to a chart.

Buy Now
Questions 10

Which of the following statements are true about the datatable on a chart? (select all that apply)

Options:

A.

By default all dimensions on the output signal are displayed.

B.

By default all metadata on the output signal are displayed.

C.

Properties cannot be displayed.

D.

A user can choose which of the output dimensions are displayed.

Buy Now
Questions 11

A customer has a very dynamic infrastructure. During every deployment, all existing instances are destroyed, and new ones are created Given this deployment model, how should a detector be created that will not send false notifications of instances being down?

Options:

A.

Create the detector. Select Alert settings, then select Auto-Clear Alerts and enter an appropriate time period.

B.

Create the detector. Select Alert settings, then select Ephemeral Infrastructure and enter the expected lifetime of an instance.

C.

Check the Dynamic checkbox when creating the detector.

D.

Check the Ephemeral checkbox when creating the detector.

Buy Now
Questions 12

A customer operates a caching web proxy. They want to calculate the cache hit rate for their service. What is the best way to achieve this?

Options:

A.

Percentages and ratios

B.

Timeshift and Bottom N

C.

Timeshift and Top N

D.

Chart Options and metadata

Buy Now
Questions 13

A DevOps engineer wants to determine if the latency their application experiences is growing fester after a new software release a week ago. They have already created two plot lines, A and B, that represent the current latency and the latency a week ago, respectively. How can the engineer use these two plot lines to determine the rate of change in latency?

Options:

A.

Create a temporary plot by dragging items A and B into the Analytics Explorer window.

B.

Create a plot C using the formula (A-B) and add a scale:percent function to express the rate of change as a percentage.

C.

Create a plot C using the formula (A/B-l) and add a scale: 100 function to express the rate of change as a percentage.

D.

Create a temporary plot by clicking the Change% button in the upper-right corner of the plot showing lines A and B.

Buy Now
Questions 14

Which of the following are required in the configuration of a data point? (select all that apply)

Options:

A.

Metric Name

B.

Metric Type

C.

Timestamp

D.

Value

Buy Now
Questions 15

Changes to which type of metadata result in a new metric time series?

Options:

A.

Dimensions

B.

Properties

C.

Sources

D.

Tags

Buy Now
Questions 16

With exceptions for transformations or timeshifts, at what resolution do detectors operate?

Options:

A.

10 seconds

B.

The resolution of the chart

C.

The resolution of the dashboard

D.

Native resolution

Buy Now
Questions 17

The built-in Kubernetes Navigator includes which of the following?

Options:

A.

Map, Nodes, Workloads, Node Detail, Workload Detail, Group Detail, Container Detail

B.

Map, Nodes, Processors, Node Detail, Workload Detail, Pod Detail, Container Detail

C.

Map, Clusters, Workloads, Node Detail, Workload Detail, Pod Detail, Container Detail

D.

Map, Nodes, Workloads, Node Detail, Workload Detail, Pod Detail, Container Detail

Buy Now
Exam Code: SPLK-4001
Exam Name: Splunk O11y Cloud Certified Metrics User Exam
Last Update: Sep 12, 2025
Questions: 57

PDF + Testing Engine

$134.99

Testing Engine

$99.99

PDF (Q&A)

$84.99