QSBA2024 Qlik Sense Business Analyst Certification Exam-2024 Questions and Answers
A business analyst is creating an app for the sales team. The app must meet several requirements:
• Compare 10 top-performing sales representatives and the amount of sales for each
• Investigate margin percentage and total sales by each product category
• View distribution of sales amount
Which visualizations should be used for this app?
The sales manager is investigating the relationship between Sales and Margin to determine if this relationship is linear when choosing the dimension Customer or Product Category.
The sales manager wants to have the potential percentage Sales for each Stage (Initial to Won) of the sales process.
Which visualizations will meet these requirements?
A business analyst needs to create two side-by-side charts for a sales department with the following data:
• Number of orders
• Name of the customer
• Percentage of margin
• Total sales
The charts use a common dimension, but each chart has different measures. The analyst needs to create a color association between the two charts on the dimension values.
Which action should the business analyst take?
A business analyst is working with a customer to refine the end user experience. The customer has the following requirements:
• Ability to provide these charts to a specific user group
• Minimize the number of navigation clicks between charts
• Achieve fastest screen response time when switching between charts
• Maximize the chart size in terms of screen real estate
Which action should the business analyst take to meet the requirements?
Exhibit.
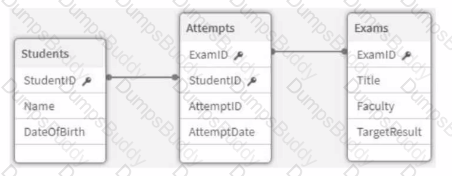
Refer to the exhibit.
An app is being developed at a university to monitor student exam attempts- Three core tables are loaded into the app for Students, Exams, and Attempts. Students can attempt the same exam multiple times.
Before building any visualizations, the business analyst needs to know:
• How many students are in the system
• What percentage of students have not yet attempted an exam
Which metadata should the analyst focus on to answer these questions?
A business analyst receives multiple requests for a variety of different filter panes to be placed on a dashboard. Users need to filter on many different values across different fields.
Which Qlik Sense feature do the users need to learn about to meet their needs?
The CEO has requested a dashboard that tracks the company's performance. The main requirements for the dashboard:
• Minimal number of visualizations or objects
• Display multiple key measures
• Ability to easily navigate to other sheets
Which features would meet the requirements?
A business analyst is building an app to analyze virus outbreaks. They create a bar chart using a dimension of Continent, and a measure of Sum (Knowningsections). They require a secondary bar on the chart, so they create a second measure using Count (MajorCities).
The bar chart adjusts, but no bars are visible for this second measure. Which action should the business analyst take to resolve this issue?
A customer needs to distribute sales data to a variety of teams. The internal analyst team requires a global view of data. The sales team requires mobile device access.
Which solution will meet the needs of both teams?
A business analyst needs to create a visualization that compares two measures over time using a continuous scale that includes a range. The measures will be Profit and Revenue.
Which visualization should the business analyst use?
In the 'Sales By Product' bar chart, a customer wants to highlight a specific product bar that includes a dynamic label. The label will only be visible when conditions are met. Which feature should the business analyst add to the bar chart?
The VP of Finance is requesting a presentable solution that allows them to share finance information in monthly meetings with C-suite executives. Given the monthly meeting agendas, the solution must be customizable.
Which Qlik Sense feature should be implemented to meet this requirement?
PDF + Testing Engine

Testing Engine
PDF (Q&A)