PL-300 Microsoft Power BI Data Analyst Questions and Answers
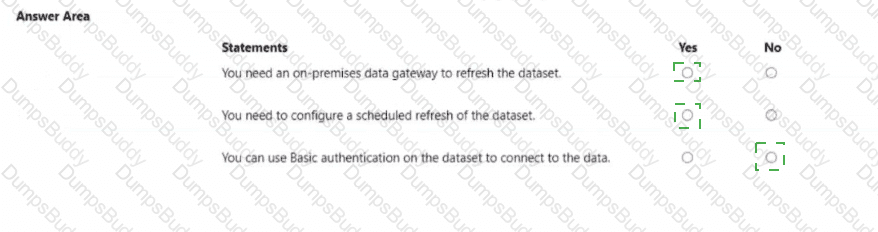
You publish the dataset to powerbi.com.
For each of the following statements, select Yes if the statement is true. Otherwise, select No.
NOTE: Each correct selection is worth one point.

You need to design the data model to meet the report requirements.
What should you do in Power BI Desktop?
You merge data from Sales.Region, Region_Manager, Sales_Manager, and Manager into a single table named Region. What should you do next to meet the reporting requirements of the executives?
You need to address the data concerns before creating the data model. What should you do in Power Query Editor?
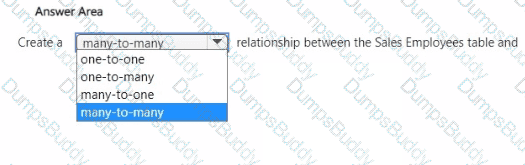
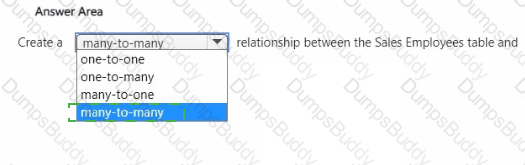
You need to create the required relationship for the executive's visual. What should you do before you can create the relationship?
You need to get data from the Microsoft SQL Server tables. What should you use to configure the connection'
You need to create a relationship between the Weekly_Returns table and the Date table to meet the reporting requirements of the regional managers. What should you do?
You need to create relationships to meet the reporting requirements of the customer service department.
What should you create?
What should you create to meet the reporting requirements of the sales department?
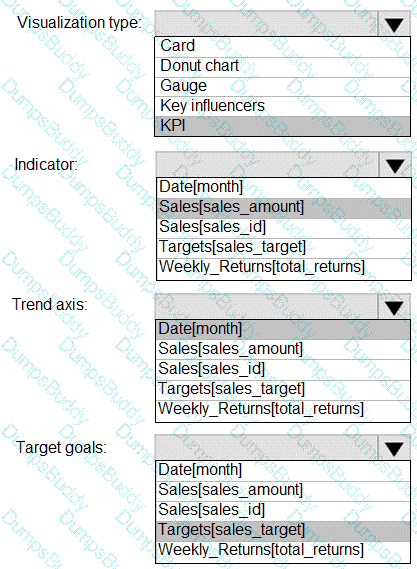
You need to create the On-Time Shipping report. The report must include a visualization that shows the percentage of late orders.
Which type of visualization should you create?
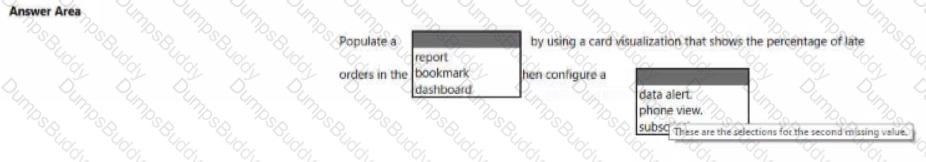
You need to create a solution to meet the notification requirements of the warehouse shipping department.
What should you do? To answer, select the appropriate options in the answer area.
NOTE: Each correct select is worth one point:

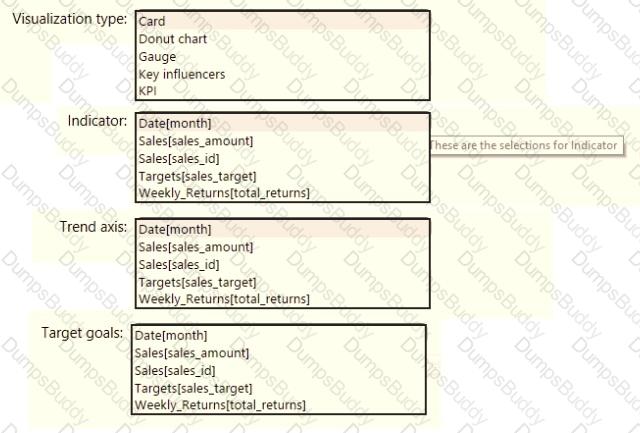
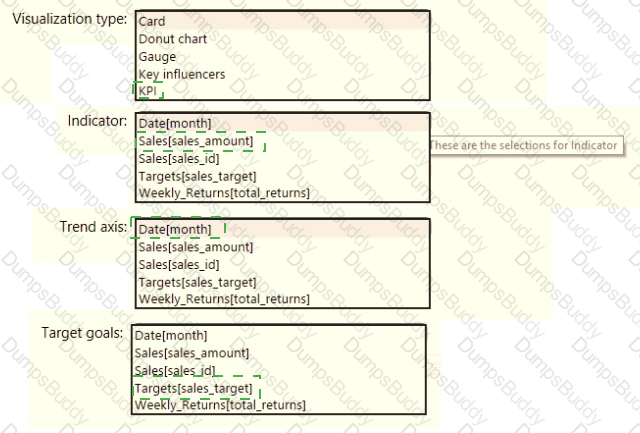
You need to create a visualization to meet the reporting requirements of the sales managers.
How should you create the visualization? To answer, select the appropriate options in the answer area.
NOTE: Each correct selection is worth one point.
You need to minimize me size of the dataset. The solution must meet the report requirements What should you do?
You use Power Query to import two tables named Order Header and Order Details from an Azure SQL database. The Order Header table relates to the Order Details table by using a column named Order ID in each table.
You need to combine the tables into a single query that contains the unique columns of each table.
What should you select in Power Query Editor?
You need to create a relationship in the dataset for RLS.
What should you do? To answer, select the appropriate options in the answer area.
NOTE: Each correct selection is worth one point.
You need to create a relationship in the data model for RLS.
What should you do? To answer, select the appropriate options in the answer area.
NOTE: Each correct selection is worth one point.
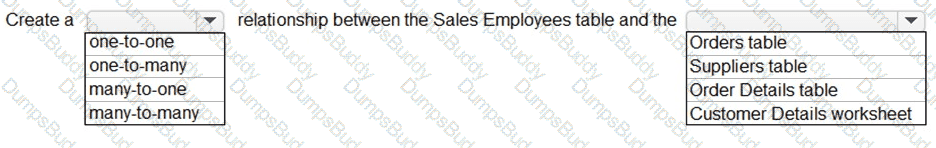
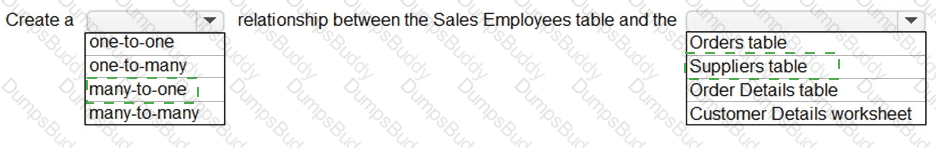
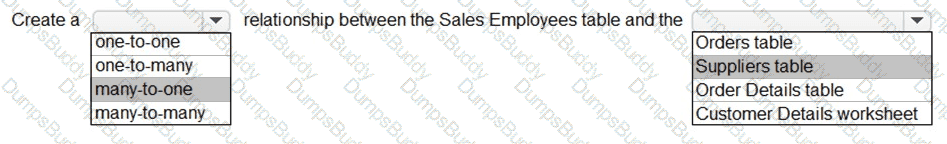
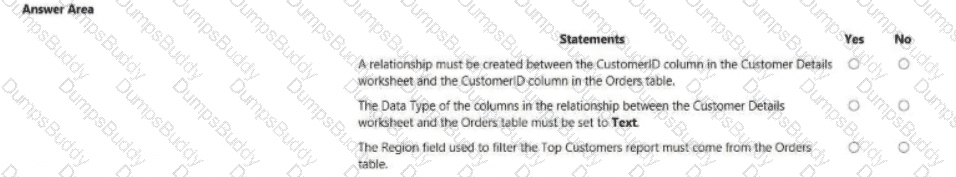
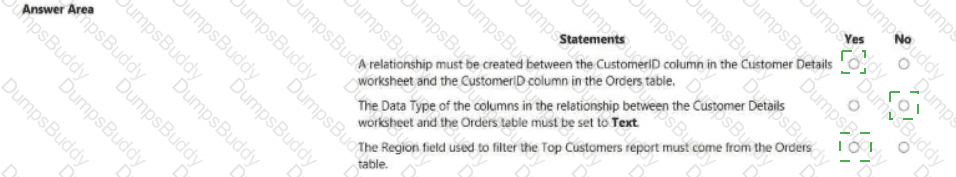
You need to design the data model and the relationships for the Customer Details worksheet and the Orders table by using Power BI. The solution must meet the report requirements.
For each of the following statement, select Yes if the statement is true, Otherwise, select No.
NOTE: Each correct selection is worth one point.
You need to create the semantic model.
Which storage mode should you use for the tables in the semantic model?
You need to minimize the size of the semantic model. The solution must meet the report requirements.
What should you do?
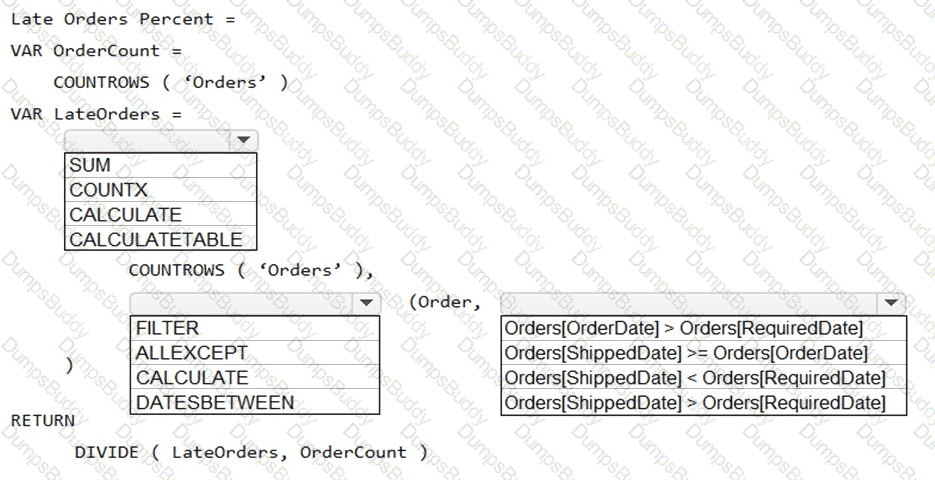
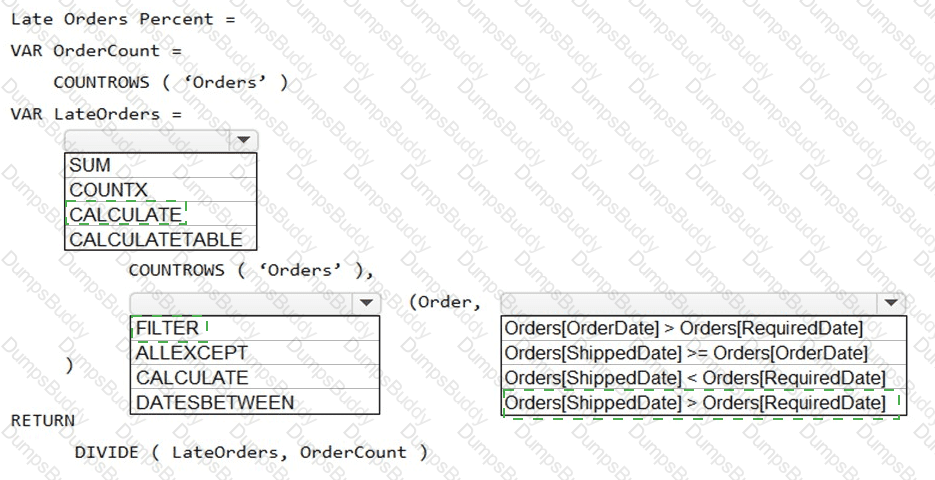
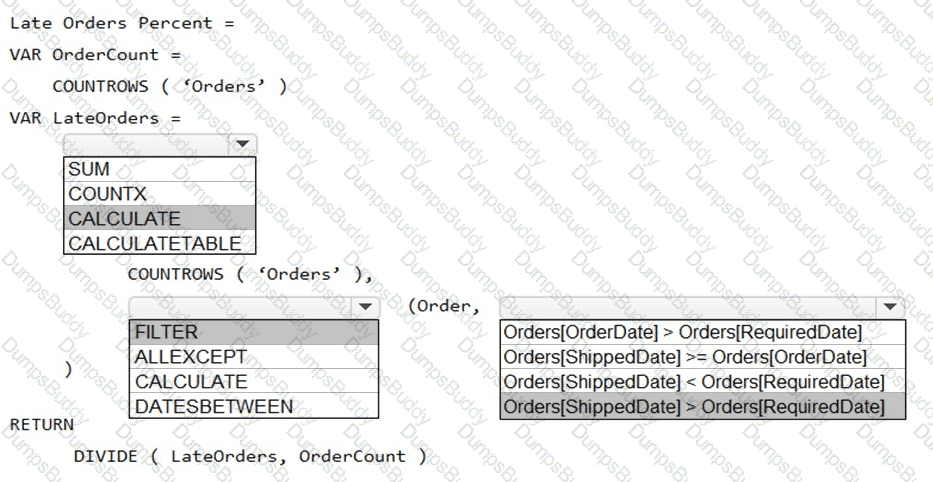
You need to create a measure that will return the percentage of late orders.
How should you complete the DAX expression? To answer, select the appropriate options in the answer area.
NOTE: Each correct selection is worth one point.
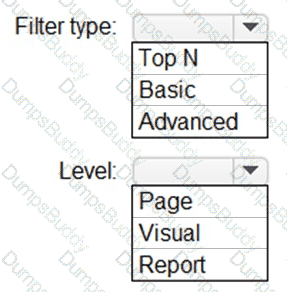
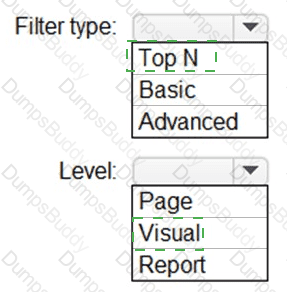
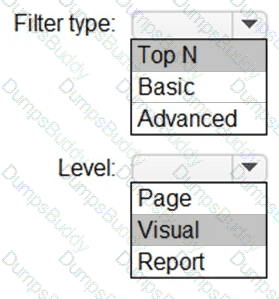
You need to create the Top Customers report.
Which type of filter should you use, and at which level should you apply the filter? To answer, select the appropriate options in the answer area.
NOTE: Each correct selection is worth one point.
You build a Power Bi report that displays loT temperature data streaming from a refrigerator.
You publish the report to the Power BI service.
You need to be notified when the temperature rises above four degrees Celsius.
What should you do?
You are modifying a Power Bi model by using Power Bl Desktop.
You have a table named Sales that contains the following fields.

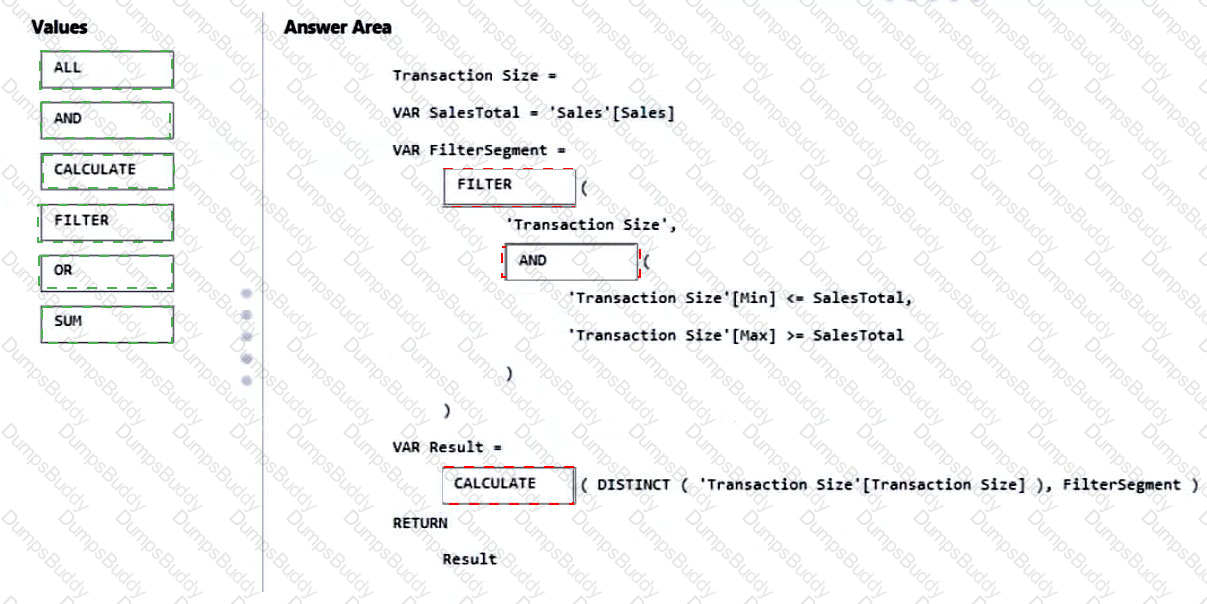
You have a table named Transaction Size that contains the following data.
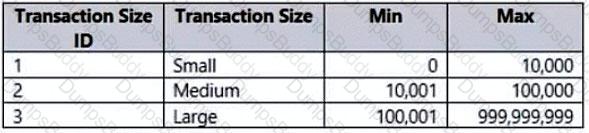
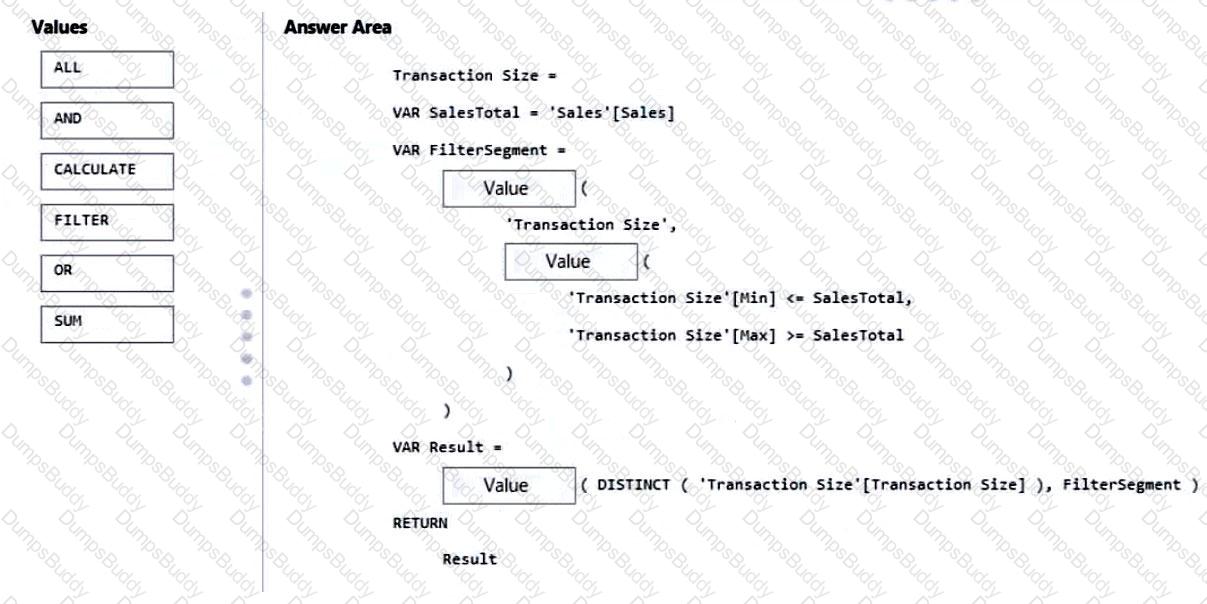
You need to create a calculated column to classify each transaction as small, medium, or large based on the value in Sales Amount.
How should you complete the code? To answer, drag the appropriate values to the correct targets. Each value may be used once, more than once, or not at all.
You may need to drag the split bar between panes or scroll to view content.
NOTE: Each correct selection is worth one point.
You need to configure access for the sales department users. The solution must me meet the security requirements. What should you do?
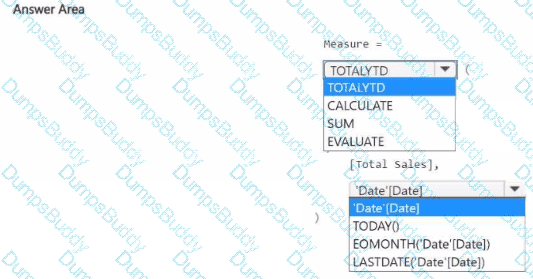
You have a Power Bl report that contains a measure named Total Sales.
You need to create a new measure that will return the sum of Total Sates for a year up to a selected date. How should you complete the DAX expression? To answer, select the appropriate options in the answer area.
NOTE: Each correct selection is worth one point.

You have the following three versions of an Azure SQL database:
Test
Production
Development
You have a dataset that uses the development database as a data source.
You need to configure the dataset so that you can easily change the data source between the development, test, and production database servers from powerbi.com.
Which should you do?
Note: This question is part of a series of questions that present the same scenario. Each question in the series contains a unique solution that might meet the stated goals. Some question sets might have more than one correct solution, while others might not have a correct solution.
After you answer a question in this section, you will NOT be able to return to it. As a result, these questions will not appear in the review screen.
You have a data source that contains a column. The column contains case sensitive data.
You have a Power BI semantic model in DirectQuery mode.
You connect to the model and discover that it contains undefined values and errors.
You need to resolve the issue.
Solution: You implicitly convert the values into the required type.
Does this meet the goal?
You have a data model that contains many complex DAX expressions. The expressions contain frequent references to the RELATED and RELATEDTABLE functions.
You need to recommend a solution to minimize the use of the RELATED and RELATEDTABLE functions.
What should you recommend?
You have a Power 81 report. The report contains a single report page that uses the detault theme.
You need to configure the report page to match the formatting shown in the following exhibit.
What should you change on the report page?
-
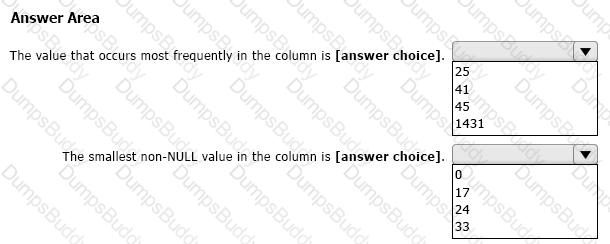
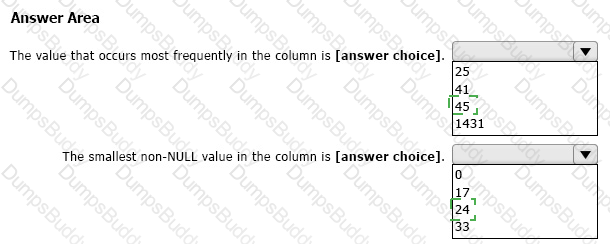
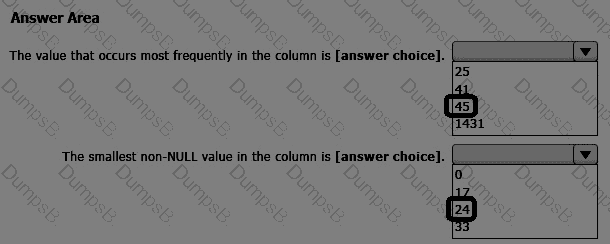
You are using Power Query Editor to preview the data in a column named Max Temp. The column statistics and value distribution are shown in the following exhibit.
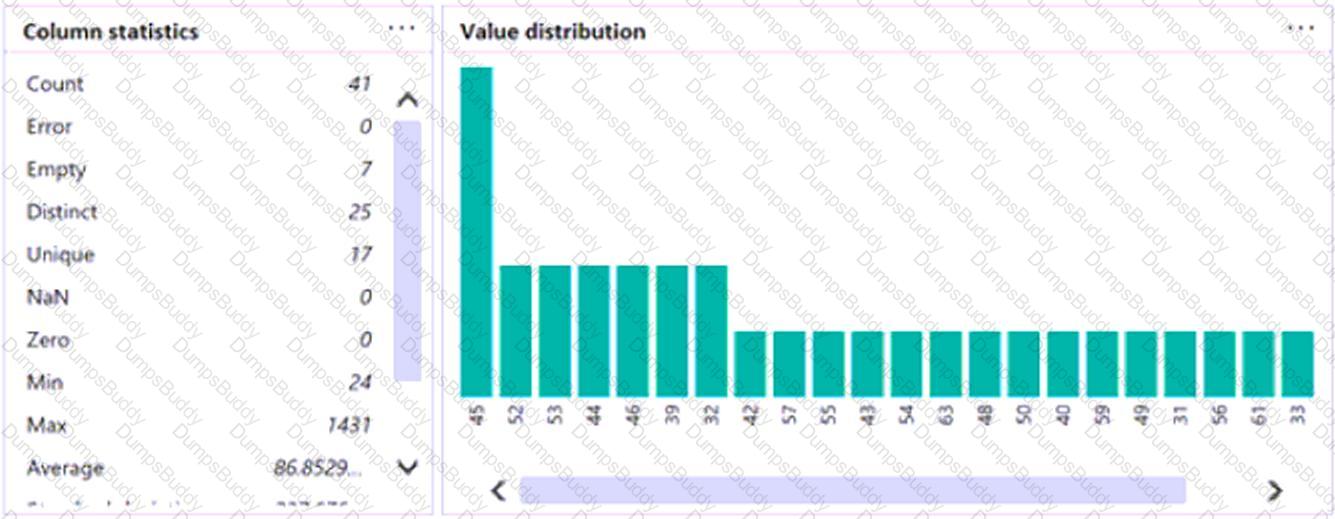
Use the drop-down menus to select the answer choice that completes each statement based on the information presented in the graphic.
NOTE: Each correct selection is worth one point.
You are building a Power Bl report that uses data from an Azure SQL database named erp1.
You Import the following tables.
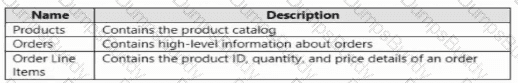
You need to perform the following analyses:
• Orders sold over time that include a measure of the total order value
• Orders by attributes of products sold
The solution must minimize update times when interacting with visuals in the report. What should you do first?
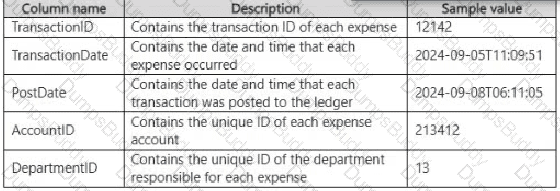
Users only use the date portion of the TransactionDate value when performing data analysis. You need to minimize the model size without affecting the analysis.
Which two actions should you perform? Each correct answer presents part of the solution.
NOTE: Each correct selection is worth one point.
Note: This question is part of a series of questions that present the same scenario. Each question in the series contains a unique solution that might meet the stated goals. Some question sets might have more than one correct solution, while others might not have a correct solution.
After you answer a question in this section, you will NOT be able to return to it. As a result, these questions will not appear in the review screen.
You have a Microsoft Excel workbook that is saved to Microsoft SharePoint Online. The workbook contains several Power View sheets.
You need to recreate the Power View sheets as reports in the Power Bl service.
Solution: From the Power Bl service, get the data from SharePoint Online, and then click Connect
Does this meet the goal?
You have a Fabric workspace named Workspace1 that contains two Power Bl reports named Report1 and Report2.
You create a workspace app that contains both reports.
You need to ensure that the app meets the following requirements:
• Report1 must be visible to all the users in your organization.
• Report2 must be visible to only a security group named Group1.
What should you do next?
You are profiling data by using Power Query Editor.
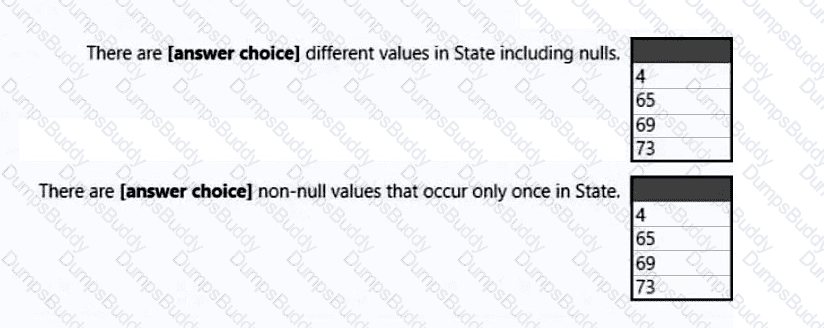
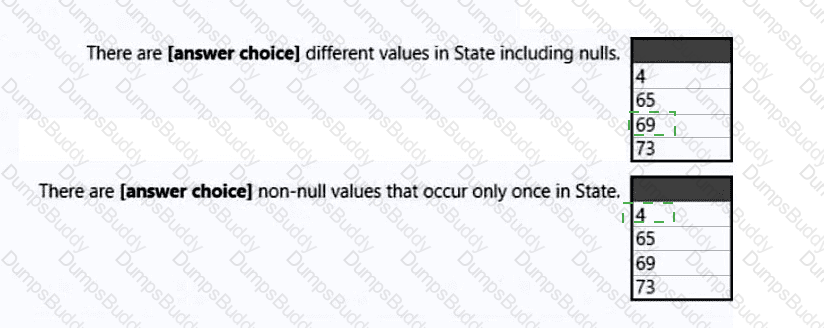
You have a table named Reports that contains a column named State. The distribution and quality data metrics for the data m State is shown in the following exhibit.
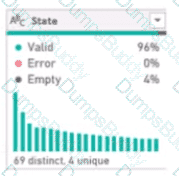
Use the drop-down menus to select the answer choice that completes each statement based on the information presented in the graphic.
NOTE: Each correct selection is worth one point.
You have a Power B1 report that contains three pages named Page1, Page2, and Page3. All the pages have the same slicers. You need to ensure that all the filters applied to Page1 apply to Page1 and Page3 only. What should you do?
You have a Power Bl report for the marketing department. The report reports on web traffic to a blog and contains data from the following tables.

There is a one-to-many relationship from Posts to Traffic that uses the URL and URL Visited columns. The report contains the visuals shown in the following table.

The dataset takes a long time to refresh.
You need to modify Posts and Traffic queries to reduce toad times.
Which two actions will reduce the toad times? Each correct answer presents part of the solution.
NOTE: Each correct selection is worth one point.
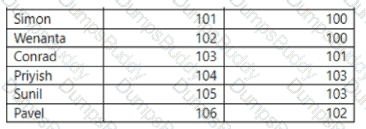
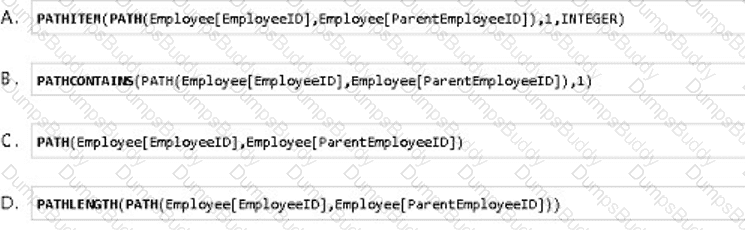
Each employee has one manager as shown in the ParentEmployeelD column,
All reporting paths lead to the CEO at the top of the organizational hierarchy.
You need to create a calculated column that returns the count of levels from each employee to the CEO.
Which DAX expression should you use?
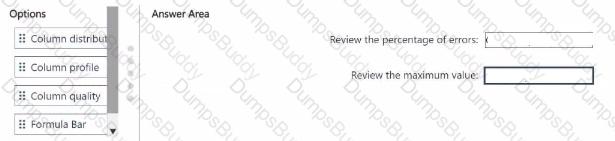
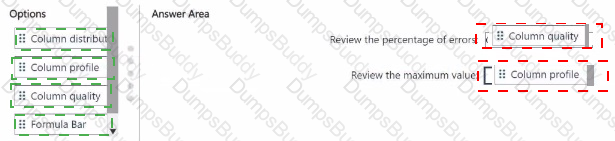
You a-e using Power Bl Desktop 10 profile data in Power Query Editor.
You need to review the percentage of errors and the maximum value of each column.
Which options should you use in Power Query Editor? To answer, drag the appropriate options to the correct requirements. Each option may be used once, more than once, or not at all. You may need to drag the split bar between panes or scroll to view content.
NOTE: Each correct selection is worth one point.
In Power BI Desktop, you are creating a report that will contain three pages.
You need to create a custom tooltip page and prepare the page for use.
Which three actions should you perform? Each correct answer presents part of the solution.
You have a table that contains the following three columns:
City
Total Sales
Occupation
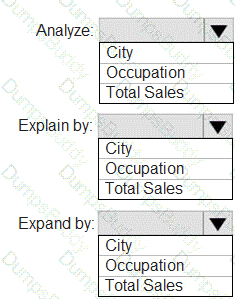
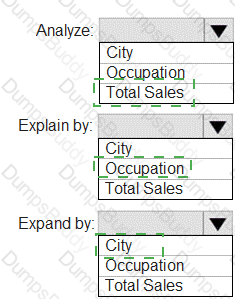
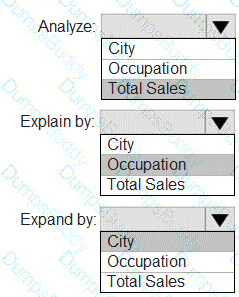
You need to create a key influencers visualization as shown in the exhibit. (Click the Exhibit tab.)
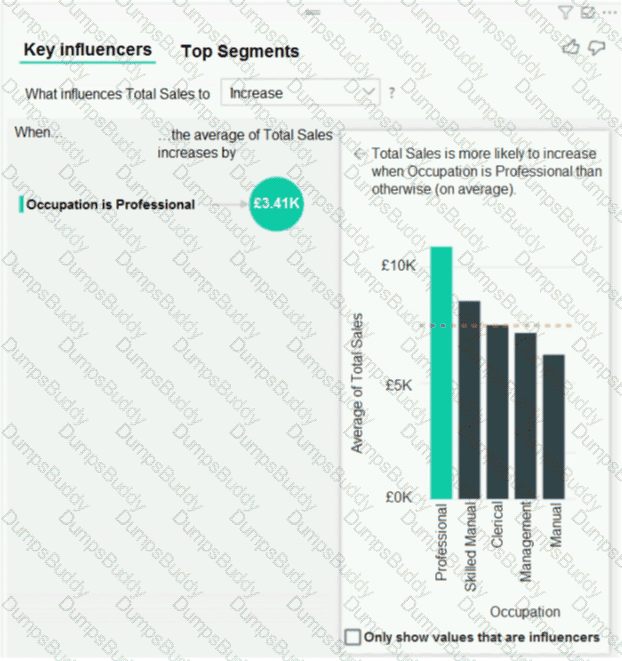
How should you configure the visualization? To answer, select the appropriate options in the answer area.
NOTE: Each correct selection is worth one point.
You have the Azure SQL databases shown in the following table.
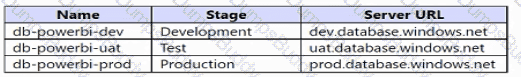
You plan to build a single PBIX file to meet the following requirements:
• Data must be consumed from the database that corresponds to each stage of the development lifecycle.
• Power Bl deployment pipelines must NOT be used.
• The solution must minimize administrative effort.
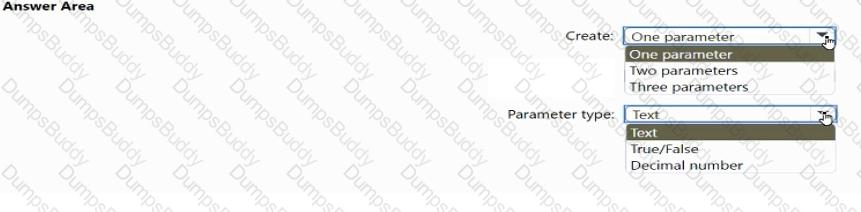
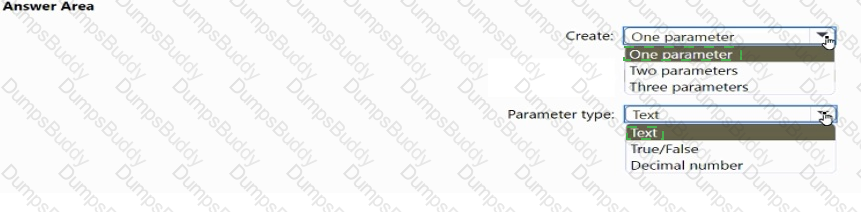
What should you do? To answer, select the appropriate options in the answer area.
You have an on-premises data gateway.
You need to reduce the amount of data sent through the gateway by semantic models that run in Import storage mode.
Solution: You decrease the dashboard cache update frequency.
Does this meet the goat?
What is the minimum number of datasets and storage modes required to support the reports?
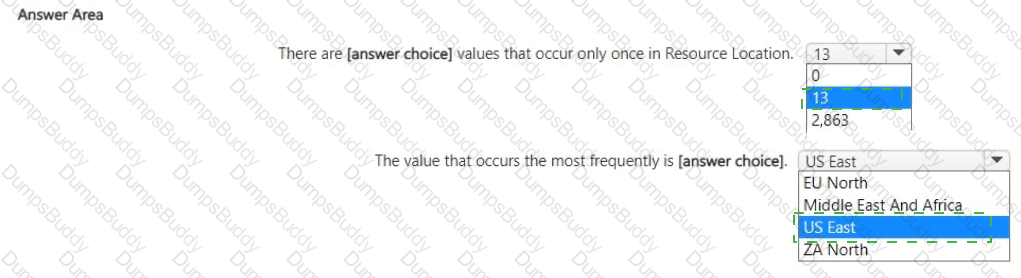
You use Power Query Editor to preview the data in a column named Resource Location.
The column statistics and value distributions of Resource Location appear as shown in the following exhibit.
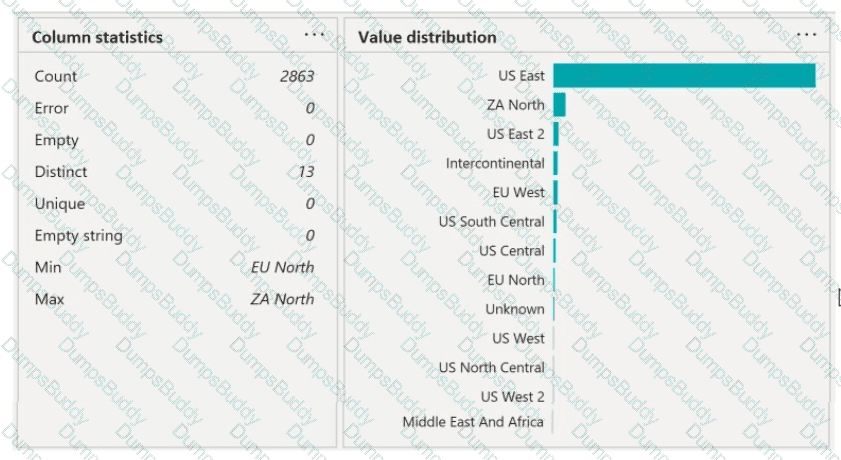
Use the drop-down menus to select the answer choice that completes each statement based on the information presented in the graphic.
NOTE: Each correct selection is worth one point.

NO: 18
You embed a Power BI report in a Microsoft SharePoint Online page.
A user name User1 can access the SharePoint Online page, but the Power BI web part displays the following error message: “This content isn’t available”.
User1 is unable to view the report.
You verify that you can access the SharePoint Online page and that the Power BI report displays as expected.
You need to ensure that User1 can view the report form SharePoint Online.
What should you do?
Which two types of visualizations can be used in the balance sheet reports to meet the reporting goals? Each correct answer presents part of the solution.
NOTE: Each correct selection is worth one point.
You need to create the relationship between the product list and the revenue results. The solution must minimize the time it takes to render visuals.
What should you set as the relationship cardinality?
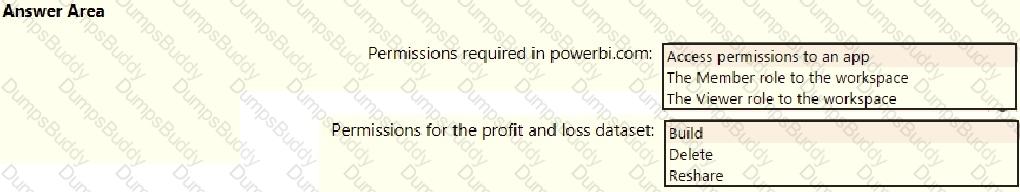
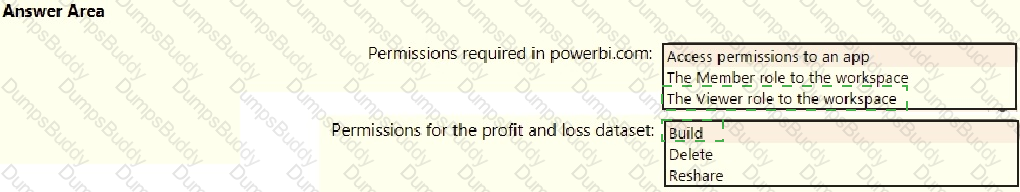
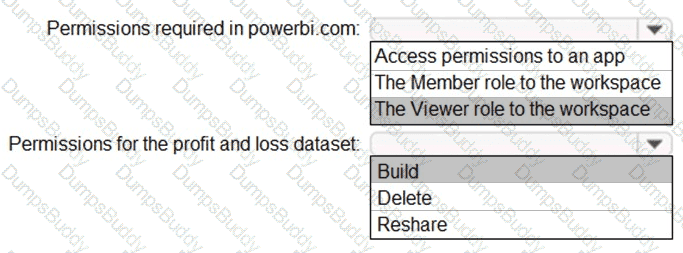
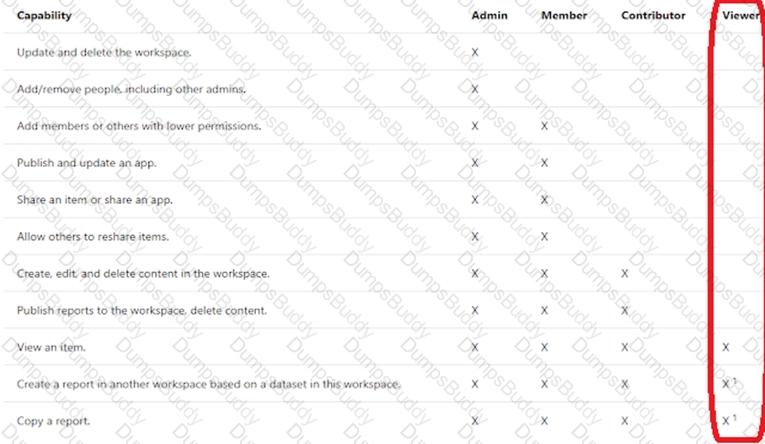
You need to grant access to the business unit analysts.
What should you configure? To answer, select the appropriate options in the answer area.
NOTE: Each correct selection is worth one point.
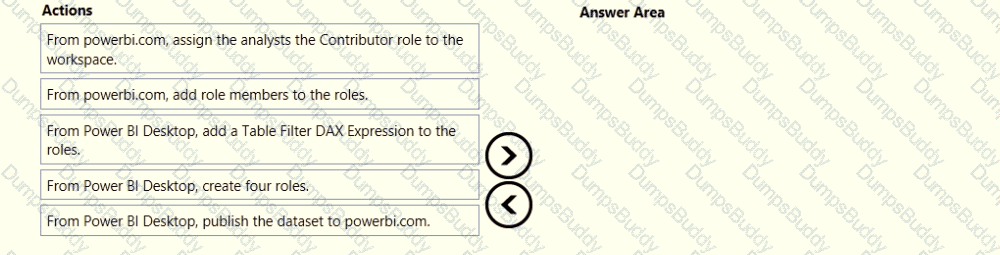
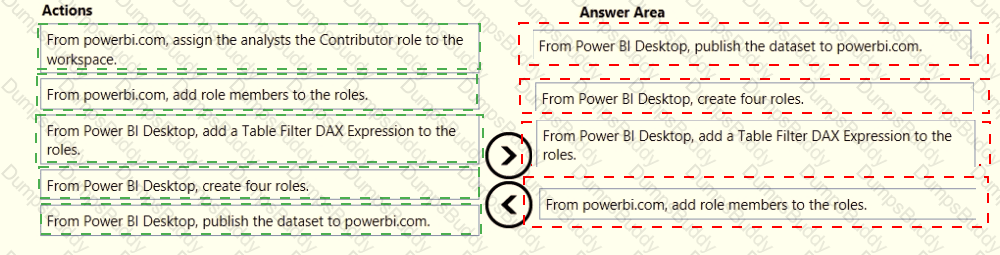
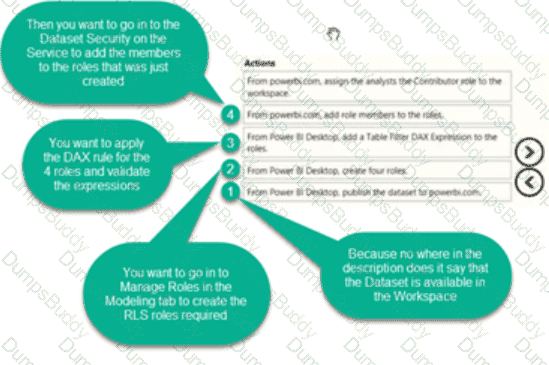
Once the profit and loss dataset is created, which four actions should you perform in sequence to ensure that the business unit analysts see the appropriate profit and loss data? To answer, move the appropriate actions from the list of actions to the answer area and arrange them in the correct order.
You need to recommend a strategy to consistently define the business unit, department, and product category data and make the data usable across reports.
What should you recommend?
You need to ensure that the data is updated to meet the report requirements. The solution must minimize configuration effort.
What should you do?
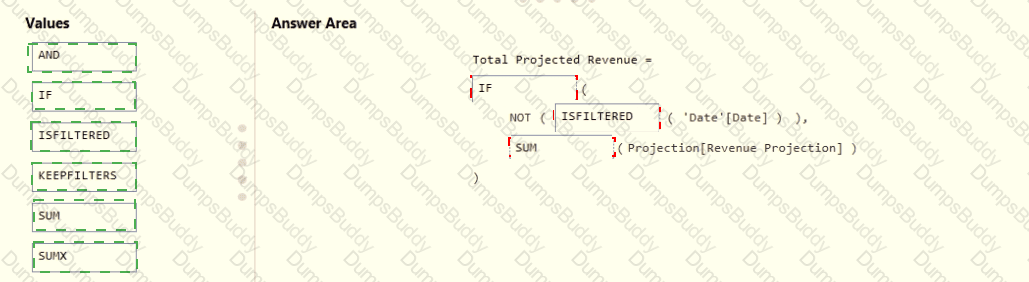
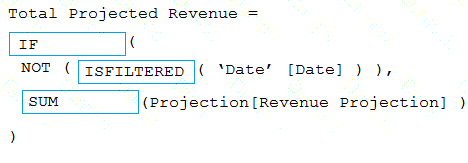
You need to create a DAX measure in the data model that only allows users to see projections at the appropriate levels of granularity.
How should you complete the measure? To answer, drag the appropriate values to the correct targets. Each value may be used once, more than once, or not at all. You may need to drag the split bar between panes or scroll to view content.
NOTE: Each correct selection is worth one point.

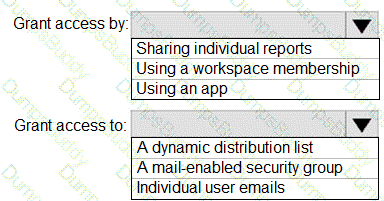
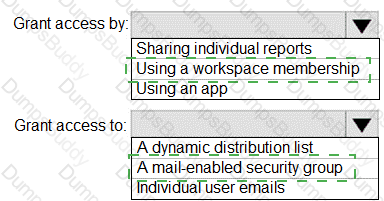
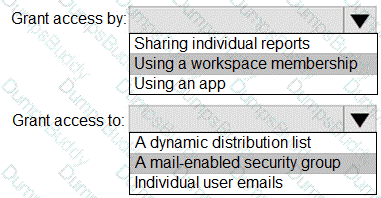
How should you distribute the reports to the board? To answer, select the appropriate options in the answer area.
NOTE: Each correct selection is worth one point.
Which DAX expression should you use to get the ending balances in the balance sheet reports?
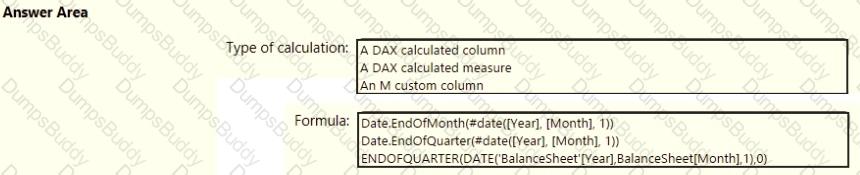
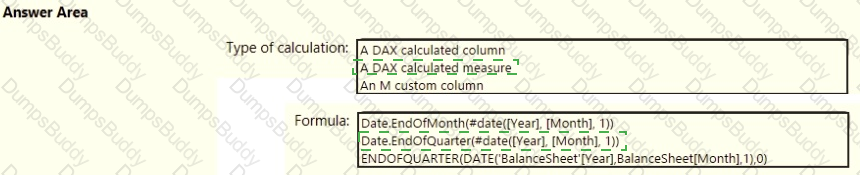
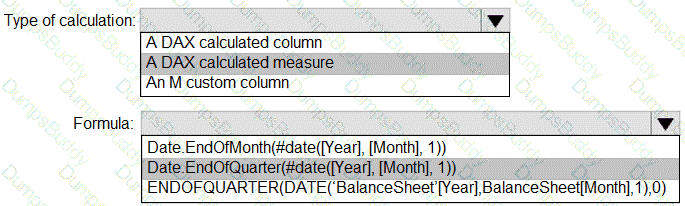
You need to calculate the last day of the month in the balance sheet data to ensure that you can relate the balance sheet data to the Date table. Which type of calculation and which formula should you use? To answer, select the appropriate options in the answer area. NOTE: Each correct selection is worth one point.
PDF + Testing Engine

Testing Engine
PDF (Q&A)