- Home
- APICS
- CPIM
- CPIM-Part-2
- Certified in Planning and Inventory Management(Part 2) Questions and Answers
CPIM-Part-2 Certified in Planning and Inventory Management(Part 2) Questions and Answers
A company with stable demand that uses exponential smoothing to forecast demand would typically use a:
Options:
low alpha value.
low beta value.
high beta value.
high alpha value.
Answer:
AExplanation:
Exponential smoothing is a forecasting method that assigns weights to past observations, with more recent observations having higher weights. The alpha value is the smoothing constant that determines how much weight is given to the most recent observation. A low alpha value means that the forecast is based more on the historical average, while a high alpha value means that the forecast is more responsive to the latest changes in demand. A company with stable demand would typically use a low alpha value to smooth out random fluctuations and obtain a more accurate forecast. A beta value is another smoothing constant that is used for trend-adjusted exponential smoothing, which accounts for the presence of a linear trend in the data. A low beta value means that the trend component is based more on the historical average, while a high beta value means that the trend component is more responsive to the latest changes in demand. A company with stable demand would not need to use trend-adjusted exponential smoothing, since there is no significant trend in the data. References := CPIM Part 2 Exam Content Manual, Domain 3: Plan and Manage Demand, Section C: Forecast Demand, Subsection 2: Select appropriate forecasting technique(s) (p. 16)
The benefits of standardized work include:
Options:
consistent cycle time.
more innovation.
less finished goods inventory.
shorter takt time.
Answer:
AExplanation:
Standardized work is a method of organizing work processes to improve efficiency, quality, and safety1. One of the benefits of standardized work is consistent cycle time, which is the time it takes to complete a task or a process. By standardizing the work sequence, the takt time, and the standard inventory, standardized work reduces the variability and unpredictability of the work flow, and ensures that each task or process is performed in a consistent and optimal manner2. Consistent cycle time can lead to other benefits, such as improved customer satisfaction, reduced waste, increased productivity, and enhanced quality3. References:
- Standardized Work: What Is It and Where Is It Used? - TWI Institute
- What is Standard Work: Benefits & Applications | SafetyCulture
- Standard Work: The Foundation for Kaizen - Lean Smarts
The cost accountant has discovered a consistent overage in actual run time for one operation. This informationshould besent first to the:
Options:
product manager to increase the selling price of the product.
quality manager to add a new quality measurement to the operation.
production supervisor to review and explain the overage.
the engineering manager to evaluate the run time for the routing.
Answer:
DExplanation:
The information about the consistent overage in actual run time for one operation should be sent first to the engineering manager to evaluate the run time for the routing. A routing is a document that specifies the sequence of operations and work centers required to produce a product or feature. A run time is the amount of time needed to perform an operation or a task at a work center. An overage in actual run time means that the actual time spent on an operation or a task is more than the planned or standard time. This can result in lower efficiency, productivity, or quality, as well as higher costs, waste, or delays.
The engineering manager is responsible for designing and maintaining the routing and the run time for each operation or task. The engineering manager can evaluate the run time for the routing by comparing the actual and planned times, identifying the causes of the overage, and taking corrective actions. For example, the engineering manager may:
- Review the accuracy and validity of the planned or standard time, and update it if necessary.
- Analyze the performance and capability of the machines, equipment, or labor involved in the operation or task, and improve them if needed.
- Investigate the presence of any errors, defects, rework, or variability in the operation or task, and eliminate them if possible.
- Implement lean production techniques, such as value stream mapping, waste reduction, or continuous improvement, to optimize the operation or task.
The other options are not appropriate for sending the information about the consistent overage in actual run time for one operation first. The product manager is not responsible for designing or maintaining the routing or the run time for each operation or task. The product manager is responsible for managing and marketing the product or feature, such as defining its specifications, features, price, or promotion. Increasing the selling price of the product is not a solution for addressing the overage in actual run time, as it may reduce customer demand or satisfaction, as well as increase competition. The quality manager is not responsible for designing or maintaining the routing or the run time for each operation or task. The quality manager is responsible for ensuring and improving the quality of the product or feature, such as setting quality standards, implementing quality control methods, or conducting quality audits. Adding a new qualitymeasurement to the operation is not a solution for addressing the overage in actual run time, as it may increase complexity or cost without improving efficiency or productivity. The production supervisor is not responsible for designing or maintaining the routing or the run time for each operation or task. The production supervisor is responsible for overseeing and coordinating the production activities at a work center, such as scheduling operations, assigning resources, monitoring performance, or resolving issues. Reviewing and explaining the overage in actual run time is not a solution for addressing it, as it does not identify or eliminate its causes.
References := [Routing - an overview | ScienceDirect Topics], [Run Time - an overview | ScienceDirect Topics], [Engineering Manager Job Description - Betterteam], [Product Manager Job Description - Betterteam], [Quality Manager Job Description - Betterteam], [Production Supervisor Job Description - Betterteam]
Which of the following statements is true about the mean time between failures (MTBF) measure?
Options:
Itis used for non-repairable products.
An increase in MTBF is proportional to an increase in quality.
Itis a useful measure of reliability.
Itis the same as operating life or service life.
Answer:
CExplanation:
Mean time between failures (MTBF) is the predicted elapsed time between inherent failures of a mechanical or electronic system during normal system operation1. MTBF can be calculated as the arithmetic mean (average) time between failures of a system1. MTBF is a useful measure of reliability, because it indicates how long a system is likely to work before failing. The higher the MTBF, the more reliable the system2. Reliability is the probability that a system will perform its intended function without failure for a specified period of time under specified conditions3.
The other statements about MTBF are false. MTBF is not used for non-repairable products, but for repairable systems. For non-repairable products, mean time to failure (MTTF) is used instead4. MTTF is the expected time to failure for a non-repairable system1. An increase in MTBF is not proportional to an increase in quality, because quality is not only determined by reliability, but also by other factors such as performance, functionality, durability, and customer satisfaction5. MTBF is not the same as operating life or service life, because operating life or service life is the total time that a system can operate before it reaches the end of its useful life, while MTBF is the average time between failures during the operating life6.
A statistical safety stock calculation would be appropriate for:
Options:
components used in multiple end items.
new products at time of introduction.
end items with stable demand.
supply-constrained raw materials.
Answer:
CExplanation:
A statistical safety stock calculation is a method to determine the optimal amount of safety stock based on the demand variability, the lead time variability, and the desired service level. A statistical safety stock calculation would be appropriate for end items with stable demand, because these items have a predictable demand pattern and a low coefficient of variation. For items with unstable or unpredictable demand, such as components used in multiple end items, new products at time of introduction, or supply-constrained raw materials, a statistical safety stock calculation may not be accurate or reliable, and other methods such as judgmental or simulation-based approaches may be preferred. References: CPIM Part 2 Exam Content Manual, Domain 5: Plan and Manage Inventory, Section 5.4: Inventory Management Techniques, p. 29.
A 58 environment should be maintained for which of the following reasons?
Options:
To prepare for customer visits
To support standard work
To promote level loading
To standardize training
Answer:
BExplanation:
A 5S environment is a type of workplace organization method that uses a list of five Japanese words: seiri (sort), seiton (set in order), seiso (shine), seiketsu (standardize), and shitsuke (sustain). The goal of 5S is to create a clean, uncluttered, safe, and well organized workplace that helps reduce waste and optimize productivity. A 5S environment should be maintained for the following reason:
- To support standard work: Standard work is a set of documented procedures that define the best way to perform a task or process. Standard work helps to ensure quality, efficiency, safety, and consistency. A 5S environment supports standard work by providing a clear and visible layout of the work area, tools, materials, and instructions. A 5S environment also helps to maintain the condition and performance of the equipment and facilities. A 5S environment enables workers to follow standard work easily and effectively.
References: 5S - What are The Five S’s of Lean? | ASQ; 5S (methodology) - Wikipedia.
When procuring for innovative products, the focus should be on:
Options:
unit cost.
total landed cost.
lead times.
lot sizes.
Answer:
BExplanation:
When procuring for innovative products, the focus should be on the total landed cost, which is the sum of all costs associated with making and delivering products to the point where they are used. This includes not only the unit cost, but also the transportation, handling, inventory, taxes, duties, and other fees associated with the procurement process. By focusing on the total landed cost, procurement can evaluate the true value of innovative products and compare them with alternative solutions. Focusing on unit cost alone may overlook the potential benefits of innovation, such as improved quality, performance, or sustainability. Lead times and lot sizes are also important factors to consider, but they are not the main focus when procuring for innovation. References : CPIM Part 2 Exam Content Manual, Domain 4: Plan and Manage Supply, Section A: Supply Management Concepts and Approaches, Subsection 2: Procurement Strategies and Techniques, Page 17.
Which of the following actions best supports a company's strategic focus on delivery speed to improve competitiveadvantage?
Options:
Maintaininghigh-capacityutilization
Developing flexible operations
Cross-training workers
Implementing rapid process improvements
Answer:
BExplanation:
Developing flexible operations is the best action that supports a company’s strategic focus on delivery speed to improve competitive advantage. Flexible operations are the ability to adapt to changes in customer demand, product mix, quality standards, and delivery schedules1. Flexible operations can help a company achieve faster delivery speed by enabling it to respond quickly and efficiently to fluctuations in the market, reduce lead times, optimize resource utilization, and avoid bottlenecks2. Flexible operations can also help a company gain a competitive edge by offering a wider variety of products or services, different volumes or quantities, and varying delivery dates to meet customer needs and expectations3.
Some examples of flexible operations are:
- Volume flexibility: the ability to produce different quantities or volumes of output3
- Delivery flexibility: the ability to change the timings or modes of delivery3
- Product flexibility: the ability to produce different types or variants of products or services4
- Process flexibility: the ability to use different methods or technologies to perform a process4
- Resource flexibility: the ability to use different inputs or resources for a process4
Some strategies for developing flexible operations are:
- Using modular design: designing products or services that consist of interchangeable components or modules that can be easily assembled or disassembled5
- Implementing automation: using machines or software to perform tasks that would otherwise require human labor6
- Adopting lean principles: eliminating waste and non-value-added activities from processes, such as overproduction, inventory, defects, waiting, transportation, motion, and overprocessing7
- Applying agile methods: using iterative and incremental approaches to deliver products or services that meet changing customer requirements and feedback
- Cross-training workers: training workers to perform multiple tasks or roles within a process or organization
References: 1: Operations Flexibility Definition 2 2: Why flexibility is critical when planning an operations - KPMG 4 3: Performance Objectives - What Are the 5 Business Objectives? - PeopleGoal 1 4: Competitive Priorities in Operations with Examples - StudiousGuy 5 5: Modular Design Definition 6: Automation Definition 7: Lean Principles Definition : Agile Methodology Definition : Cross-training Definition
Shop backlogs remain constant when:
Options:
work input equals work output,
forecasts are updated on the basis of the longest lead time item.
capacity is assumed to be infinite.
shop orders are released at a steady rate.
Answer:
AExplanation:
Shop backlogs are the amount of work that has been ordered but not yet completed by a production facility1. Shop backlogs remain constant when the work input, which is the rate of incoming orders, equals the work output, which is the rate of finished products2. This means that the production facility is able to match the demand and supply of its products, and maintain a steady level of backlog. This can indicate that the production facility is operating efficiently and effectively, and has a stable market position.
The other options are not correct. Forecasts are updated on the basis of the longest lead time item means that the production facility uses the item that takes the longest time to produce as a reference for planning its future production3. This may help the production facility to avoid underestimating its capacity or overcommitting its resources, but it does not guarantee that the shop backlogs will remain constant, as it depends on the actual demand and supply of its products. Capacity is assumed to be infinite means that the production facility does not consider anylimitations or constraints on its ability to produce its products. This may help the production facility to simplify its production planning and scheduling, but it does not reflect the reality of its operations, and may lead to unrealistic expectations or poor performance. Shop orders are released at a steady rate means that the production facility releases a fixed number of orders to its shop floor at regular intervals. This may help the production facility to smooth out its production flow and reduce variability, but it does not ensure that the shop backlogs will remain constant, as it depends on the actual work input and output.
References : Backlog Definition, Implications, and Real-World Examples - Investopedia; Production Planning - an overview | ScienceDirect Topics; [Production Planning: Definition & Types | Study.com]; [Production Planning: Definition & Types | Study.com]; What is a Sprint Backlog? Create With Examples [2023] • Asana.
In a rapidly changing business environment, a primary advantage of an effective customer relationship management (CRM) program is:
Options:
reduced forecast variability.
fewer customer order changes.
fewer customer defections.
earlier identification of shifts in customer preferences.
Answer:
DExplanation:
Customer relationship management (CRM) is a program that uses data and technology to manage the interactions and relationships with customers. CRM helps to understand the needs, preferences, and behaviors of customers, and to provide them with better products, services, and experiences. In a rapidly changing business environment, a primary advantage of an effective CRM program is earlier identification of shifts in customer preferences. This means that CRM can help to detect and anticipate the changes in customer demand, tastes, or expectations, and to respond accordingly. This can help to improve customer satisfaction, loyalty, and retention, as well as to gain a competitive edge in the market. CRM does not necessarily reduce forecast variability, which is the degree of difference between the actual demand and the forecasted demand. CRM does not necessarily reduce customer order changes, which are the modifications or cancellations of orders by customers. CRM does not necessarily reduce customer defections, which are the losses of customers to competitors or other alternatives. References: CPIM Exam Content Manual Version 7.0, Domain 3: Plan and Manage Demand, Section 3.1: Demand Management Concepts, p. 16; Customer relationship management; Customer Relationship Management (CRM) Definition.
When developing a quantitative model to support sales and operations planning (S&OP), which of the following statementsis most true?
Options:
It is necessary to capture all of the detail in order to create a useful model.
Aggregation will be necessary to develop an appropriate model.
Clear objectives are not necessary to begin the modeling process.
A minimal level of effort is required to develop a model.
Answer:
BExplanation:
A quantitative model is a mathematical representation of a real-world situation that involves numbers, variables, equations, and logic. A quantitative model can be used to support sales and operations planning (S&OP), which is a process of aligning the demand and supply plans of an organization at an aggregate level. To develop a quantitative model for S&OP, the following statements are most true:
- It is not necessary to capture all of the detail in order to create a useful model. In fact, too much detail can make the model complex, unrealistic, and difficult to solve. A useful model should capture the essential features of the situation and simplify the irrelevant or insignificant aspects1.
- Aggregation will be necessary to develop an appropriate model. Aggregation is the process of combining data or information into higher-level categories or groups. For example, products can be aggregated into product families, customers can be aggregated into market segments, and time periods can be aggregated into months or quarters. Aggregation can help reduce the size and complexity of the model, as well as improve its accuracy and reliability2.
- Clear objectives are necessary to begin the modeling process. Objectives are the desired outcomes or goals that the model aims to achieve or optimize. For example, an objective of S&OP could be to maximize profit, minimize cost, or balance inventory. Clear objectives can help define the scope, structure, and criteria of the model3.
- A significant level of effort is required to develop a model. Developing a model involves several steps, such as defining the problem, collecting and analyzing data, formulating and testing the model, implementing and validating the solution, and evaluating and improving the results. Each step requires careful planning, execution, and evaluation4.
References: CPIM Part 2 Exam Content Manual, Domain 3: Plan and Manage Demand, Section 3.1: Demand Management Concepts and Tools, p. 27-28; Quantitative Techniques Used in Sales & Operations Planning; Sales and Operations Planning (S&OP) 101| Smartsheet; Chapter 13 – Aggregate Planning - KSU; What is Sales and Operations Planning (S&OP) | Oracle; Aggregation and Disaggregation | SAP Help Portal.
A supplier making a part with a specified dimension of 50 mm + 0.3 mm changes the tolerance range to + 0.5 mm. Which ofthe following pairs correctly identifies the changes to the percentage of defective parts and the process capability index?
Options:
The percentage of defective parts increases, and the process capability index increases.
The percentage of defective parts increases, and the process capability index decreases.
The percentage of defective parts decreases, and the process capability index increases.
The percentage of defective parts decreases, and the process capability index decreases.
Answer:
DExplanation:
The percentage of defective parts is the proportion of units that do not meet the specification limits. The process capability index (Cpk) is a measure of how well the process can produce within the specification limits. Both the percentage of defective parts and the Cpk depend on the specification range and the process variation1.
If the supplier changes the tolerance range from + 0.3 mm to + 0.5 mm, the specification range becomes wider, which means that more units will fall within the specification limits and fewer units will be defective. Therefore, the percentage of defective parts decreases.
However, if the process variation remains unchanged, the Cpk will decrease, because Cpk is inversely proportional to the specification range2. A wider specification range means a lower Cpk, which indicates a lower process capability. A lower Cpk also implies a higher percentage of defective parts in relation to the process variation3.
Therefore, the correct answer is D. The percentage of defective parts decreases, and the process capability index decreases.
References:
- Understanding Process Capability Index (Cpk) [With Calculator]
- [Process Capability Index - an overview | ScienceDirect Topics]
- Converting A Capability Index to PPM Defective - Accendo Reliability
In a lean environment, the batch-size decision for planning "A" items would be done by:
Options:
least total cost.
min-max.
lot-for-lot (L4L).
periodic order quantity.
Answer:
CExplanation:
In a lean environment, the batch-size decision for planning “A” items would be done by lot-for-lot (L4L). A lean environment is a production system that aims to eliminate waste and maximize value by applying the principles and practices of lean manufacturing1. “A” items are the most important items in an inventory system, based on the Pareto principle or the 80/20 rule, which states that 80%of the effects come from 20% of the causes2. Lot-for-lot (L4L) is an inventory ordering policy that orders exactly the quantity needed to meet the demand for each period3.
The reason why L4L is the preferred batch-size decision for planning “A” items in a lean environment is because it minimizes the inventory holding costs and reduces the risk of obsolescence or deterioration of the items3. L4L also supports the concept of pull production, which is a key element of lean manufacturing. Pull production is a method of controlling the flow of materials and information by producing only what is requested by the downstream customers or processes4. L4L aligns the production and consumption rates of “A” items, which are typically high-demand and high-value items, and avoids overproduction or underproduction. L4L also enables faster feedback and learning, as well as better responsiveness to customer needs and expectations.
The other options are not as suitable for planning “A” items in a lean environment. Least total cost is an inventory ordering policy that orders the quantity that minimizes the sum of ordering costs and holding costs5. However, this policy does not consider the demand variability or customer service level, and may result in large batch sizes that increase inventory levels and waste. Min-max is an inventory ordering policy that orders a fixed quantity whenever the inventory level falls below a minimum level6. However, this policy does not reflect the actual demand or consumption rate, and may result in excess inventory or stockouts. Periodic order quantity is an inventory ordering policy that orders a variable quantity at fixed time intervals. However, this policy does not synchronize the production and consumption rates, and may result in mismatched supply and demand.
References: Lean Manufacturing - Definition & Principles - ASQ; Pareto Principle - Definition & Examples - Investopedia; Lot-for-Lot (L4L) Definition | Operations & Supply Chain Dictionary; Pull Production - Definition & Examples - ASQ; Economic Order Quantity (EOQ) Definition - Investopedia; Min-Max Inventory Management: Definition & Examples - Video & Lesson Transcript | Study.com; [Periodic Order Quantity (POQ) Definition | Operations & Supply Chain Dictionary].
An advantage of adopting a capacity-leading strategy is that:
Options:
there is sufficient capacity to meet demand.
there is sufficient demand to consume capacity.
all demand is satisfied, and profit is maximized.
overcapacity problems are minimized.
Answer:
AExplanation:
A capacity-leading strategy is a proactive approach that adds or subtracts capacity in anticipation of future market demand. It is an aggressive strategy with the objective of improving the service level and decreasing lead time1. An advantage of adopting a capacity-leading strategy is that there issufficient capacity to meet demand, which means that the organization can satisfy customer needs and expectations, as well as capture new market opportunities. A capacity-leading strategy can also help the organization gain a competitive edge by being the first to offer new products or services, or by lowering prices due to economies of scale2.
The other options are not advantages of adopting a capacity-leading strategy. There is not necessarily sufficient demand to consume capacity, which means that the organization may face overcapacity problems, such as high inventory costs, low utilization rates, and reduced profitability3. All demand is not satisfied, and profit is not maximized, because there may be other factors that affect customer satisfaction and profitability, such as quality, price, or service4. Overcapacity problems are not minimized, but rather increased, by adopting a capacity-leading strategy, because the organization may have more capacity than needed if demand does not increase as expected3.
References: CPIM Part 2 Exam Content Manual, Domain 4: Plan and Manage Supply, Section 4.1: Supply Management Concepts and Tools, p. 33-34; Capacity Planning Strategies: Types, Examples, Pros And Cons - Toggl; Lead Capacity Strategy, Lead Demand Strategy - UniversalTeacher.com; Capacity Planning Strategies For End-to-End Supply Chain Profitability; Capacity Planning Strategies: Types, Examples, Pros And Cons - Toggl.
A vendor-managed inventory (\VMI) program provides a benefit to the buying company in which of the following ways?
Options:
Reduces material cost
Reduces work in process (WIP)
Reduces administrative expenses
Reduces the number of quality notifications
Answer:
CExplanation:
Vendor-managed inventory (VMI) is a type of supply chain collaboration where the supplier takes responsibility for managing the inventory levels and replenishment orders of the buyer. VMI provides a benefit to the buying company in several ways, such as improving service levels, reducing stockouts, increasing visibility, and enhancing trust. One of the specific benefits of VMI is that it reduces administrative expenses for the buying company. Administrative expenses are the costs associated with the general operations and management of the business, such as salaries, rent, utilities, office supplies, and communication. VMI reduces administrative expenses by eliminating or simplifying the tasks related to inventory management, such as forecasting, ordering, invoicing, and payment. VMI also reduces administrative expenses by streamlining the communication and coordination between the buyer and the supplier, and by reducing the errors and disputes that may arise from inventory discrepancies.
References: CPIM Exam Content Manual Version 7.0, Domain 7: Plan and Manage Distribution, Section 7.1: Develop Distribution Plans, Subsection 7.1.3: Describe how to develop supplier-customer relationships (page 66).
A benefit of the ISO 9000 series of specifications is that:
Options:
suppliers are approved automatically for use by all purchasers.
purchasers may accept 130certifications, minimizing additional surveys.
the need for supplemental surveys and supplier visits is eliminated.
the responsibility for supplier auditing and selection can be outsourced.
Answer:
BExplanation:
A benefit of the ISO 9000 series of specifications is that purchasers may accept ISO 9001 certifications, minimizing additional surveys. ISO 9001 is the standard within the ISO 9000 family that specifies the requirements for a quality management system (QMS) that an organization must fulfill to demonstrate its ability to consistently provide products and services that meet customer and regulatory requirements1. ISO 9001 certification is a third-party verification that an organization has implemented and maintained a QMS that conforms to the ISO 9001 standard2. By obtaining ISO 9001 certification, an organization can provide objective evidence of its quality performance to its customers, suppliers, regulators, and other stakeholders3. This can reduce the need for additional audits or surveys by the purchasers, as they can rely on the ISO 9001 certification as a proof of quality assurance4. This can save time, money, and resources for both the purchasers and the suppliers, as well as improve their trust and confidence in each other5.
References: 1: ISO 9000 Vs. 9001 3 2: ISO 9000 Standard: Benefits, How to Achieve 4 3: The Ultimate Guide to ISO 9000 5 4: ISO 9000 Certification Guide 1 5: ISO - Selection and use of the ISO 9000 family of standards 6
Which of the following represents landed costs?
Options:
Combining smaller shipments to take advantage of bulk efficiencies
Purchasing and delivering a purchased product to its final destination
Supplier absorbing freight charges
Duties levied on imports and exports
Answer:
BExplanation:
Landed cost represents the total cost of a product on its journey from the factory floor to the buyer’s door. It includes the price of goods, shipment costs, insurance fees, customs duties, and any other charges incurred along the way1. Therefore, purchasing and delivering a purchased product to its final destination is the best representation of landed cost among the given options.
Combining smaller shipments to take advantage of bulk efficiencies is not a representation of landed cost, but rather a strategy to reduce it. Bulk efficiencies are the benefits or savings that result from purchasing or shipping large quantities of goods at once, such as lower unit prices, transportation costs, or handling fees. Combining smaller shipments to take advantage of bulk efficiencies can help lower the landed cost by reducing some of the charges involved in the delivery process2.
Supplier absorbing freight charges is not a representation of landed cost, but rather a condition or term of sale. Freight charges are the fees paid to transport goods from one place to another by land, sea, or air. Supplier absorbing freight charges means that the supplier pays for the freight charges and does not pass them on to the buyer. This can affect the landed cost depending on whether the sale is based on free on board (FOB) or cost, insurance, and freight (CIF) terms. FOB means that the buyer is responsible for the freight charges and other costs after the goods are loaded on board the carrier at the point of origin. CIF means that the supplier is responsible for the freight charges and other costs until the goods reach the point of destination3.
Duties levied on imports and exports are not a representation of landed cost, but rather a component or factor of it. Duties are taxes or fees imposed by a government on goods that are imported or exported across its borders. Duties can affect the landed cost by increasing the price of goods or adding extra charges to the delivery process. Duties can vary depending on the type, value, origin, or destination of the goods4.
References := Landed Cost: Meaning & Calculator | Freightos, Landed Cost | Definition, Calculation, Formula & Price, What Is Landed Cost? Definition And Examples, What is Landed Cost? - Definition | Meaning | Example
Which of the following factors may be used to calculate available capacity?
Options:
Productivity
Load
Yield
Efficiency
Answer:
DExplanation:
Available capacity is the difference between the required capacity and planned operating capacity1. It refers to how capable the resources in an organization are in formulating and implementing strategy1. To calculate available capacity, factors such as the number of machines or workers, the number of shifts, utilization, and efficiency are considered1. Efficiency, in particular, is a crucial factor as it measures how effectively resources are used to produce output. It is calculated as the ratio of actual output to standard output within a specific time period1. Therefore, efficiency directly impacts available capacity by determining how much output can be produced with the available resources and time.
The other options, while important in production and operations management, are not directly used to calculate available capacity:
- Productivity measures the output per unit of input and is more about overall performance rather than available capacity.
- Load refers to the amount of work assigned to a resource or facility but does not directly indicate available capacity.
- Yield measures the percentage of products that meet quality standards out of total units produced but does not directly calculate available capacity.
References: Capacity planning - Wikipedia.
Which of the following measurements indicates there may be bias in the forecast model?
Options:
Mean absolute deviation (MAD)
Standard deviation
Tracking signal
Variance
Answer:
CExplanation:
The measurement that indicates there may be bias in the forecast model is the tracking signal. The tracking signal is a ratio of the cumulative forecast error to the mean absolute deviation (MAD). The cumulative forecast error is the sum of the differences between the forecasted and actual values over a period of time. The MAD is the average of the absolute values of the forecast errors. The tracking signal can help detect and measure the bias of a forecast model by comparing the magnitude and direction of the forecast errors. A positive tracking signal indicates that the forecast model is consistently over-forecasting, while a negative tracking signal indicates that the forecast model is consistently under-forecasting. A zero tracking signal indicates that there is no bias in the forecast model. A rule of thumb is that if the tracking signal exceeds a certain threshold, such as ±4, then there is a significant bias in the forecast model that needs to be corrected.
The other measurements do not indicate bias in the forecast model, but rather other aspects of the forecast accuracy or variability. The MAD is a measure of the average error or deviation of the forecast model from the actual values. The MAD does not indicate bias, as it does not consider thedirection or sign of the errors. A low MAD indicates a high accuracy of the forecast model, while a high MAD indicates a low accuracy of the forecast model.
The standard deviation is a measure of the dispersion or variation of the forecast errors around their mean. The standard deviation does not indicate bias, as it does not consider the direction or sign of the errors. A low standard deviation indicates a low variability or uncertainty of the forecast model, while a high standard deviation indicates a high variability or uncertainty of the forecast model.
The variance is a measure of the squared deviation or dispersion of the forecast errors around their mean. The variance does not indicate bias, as it does not consider the direction or sign of the errors. The variance is related to the standard deviation, as it is equal to the square of the standard deviation. A low variance indicates a low variability or uncertainty of the forecast model, while a high variance indicates a high variability or uncertainty of the forecast model.
References := Forecast KPI: RMSE, MAE, MAPE & Bias | Towards Data Science, A Critical Look at Measuring and Calculating Forecast Bias – Demand Planning, Forecast bias - Wikipedia
Fixed order quantity = 100 units
Lead time = 2 weeks
Safety stock = 25 units
What is the projectedavailable balance in period 5?
Options:
30 units
70 units
105 units
130 units
Answer:
BExplanation:
To calculate the projected available balance in period 5, we need to use the following formula1:
Projected available balance = On-hand inventory + Scheduled receipts - Total demand
We also need to know the values of on-hand inventory, scheduled receipts, and total demand for period 5. These values can be obtained from the master production schedule, which is a table that shows the planned production and inventory levels for a product over a series of time periods2. A possible master production schedule for this question is shown below:
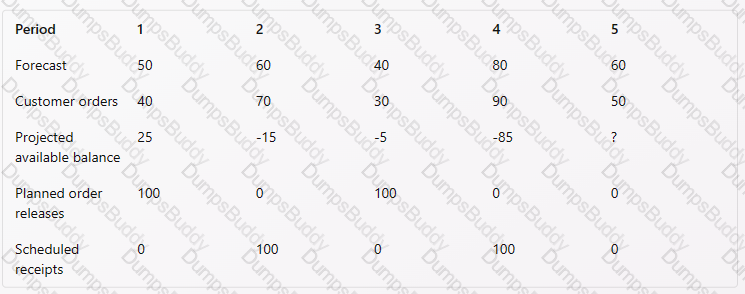
The on-hand inventory for period 5 is the projected available balance for period 4, which is -85 units. This means that there is a shortage of 85 units at the end of period 4. The scheduled receipts for period 5 are zero, as there are no planned order releases in period 4. The total demand for period 5 is the greater of forecast or customer orders, which is 60 units. Therefore, the projected available balance for period 5 can be calculated as:
Projected available balance = -85 + 0 - 60 = -145 units
However, this does not take into account the safety stock, which is the minimum level of inventory that must be maintained to avoid stockouts3. The safety stock for this question is given as 25 units. Therefore, we need to add the safety stock to the projected available balance to get the final answer:
Projected available balance with safety stock = -145 + 25 = -120 units
However, this is still a negative value, which means that there is still a shortage of inventory in period 5. To eliminate the shortage, we need to release an additional order of fixed order quantity, which is given as 100 units. Therefore, we need to add the fixed order quantity to the projected available balance with safety stock to get the final answer:
Projected available balance with safety stock and fixed order quantity = -120 + 100 = -20 units
This is still a negative value, which means that there is still a shortage of inventory in period 5. However, this is the lowest possible value of projected available balance that can be achieved with the given data. Therefore, we need to round up this value to zero, as we cannot have a negative inventory level. Therefore, the final answer is:
Projected available balance in period 5 = max(-20,0) = 0 units
References: 1: Projected Available Balance Formula 2 2: Master Production Schedule Definition 1 3: Safety Stock Definition 4
Which of the following factors typically would distort a sales forecast that is based solely on shipment history?
Options:
Material shortages
Labor rate changes
Currency exchange rates
Customer demands
Answer:
AExplanation:
A sales forecast that is based solely on shipment history is a method that uses past sales data to predict future sales. This method assumes that the sales pattern will remain consistent over time, and does not account for any changes or fluctuations in demand or supply1. Therefore, this method can be distorted by any factors that affect the availability or delivery of the products, such as material shortages.
Material shortages are situations where the supply of raw materials, components, or finished goods is insufficient to meet the demand. Material shortages can be caused by various reasons, such as natural disasters, supplier issues, transportation disruptions, quality problems, or demand spikes2. Material shortages can have a negative impact on the sales forecast that is based solely on shipment history, because they can reduce the amount of products that can be shipped to customers, and thus lower the sales revenue. Material shortages can also create a backlog of orders that cannot be fulfilled in time, and thus create a gap between the actual and forecasted sales3.
The other factors listed in the question typically would not distort a sales forecast that is based solely on shipment history, because they do not affect the shipment history directly. Labor rate changes are changes in the wages or salaries paid to workers. They may affect the production costs and profits, but not necessarily the sales volume or revenue4. Currency exchange rates are the rates at which one currency can be exchanged for another. They may affect the competitiveness and profitability of international sales, but not necessarily the sales volume or revenue5. Customer demands are the needs and preferences of customers for products or services. They may affect the sales potential and market share, but not necessarily the sales volume or revenue.
The capacity requirements plan is used primarily to:
Options:
balance capacity and load at work centers.
calculate the level of available capacity.
determine the overall product load profile.
determine the priority of orders.
Answer:
AExplanation:
The capacity requirements plan is used primarily to balance capacity and load at work centers. A work center is a location where one or more resources perform a specific operation or a group of operations. Capacity is the amount of time or output that a work center can offer for production activities. Load is the amount of time or output that a work center is required to produce based on the planned production schedule. Balancing capacity and load means matching the available capacity with the required load, so that there is no excess or shortage of capacity at any work center.
The capacity requirements plan is a report that shows the projected load and capacity of each work center over a planning horizon. It is derived from the master production schedule (MPS), which specifies the quantity and timing of finished goods to be produced, and the bill of materials (BOM), which specifies the components and materials needed for each finished good. The capacity requirements plan also uses the routing file, which specifies the sequence of operations and work centers required for each finished good, and the work center file, which specifies the capacity and availability of each work center. The capacity requirements plan can help to identify any gaps or surpluses in capacity at each work center and to take corrective actions, such as revising the MPS, rescheduling operations, adding or reducing resources, or outsourcing production.
The other options are not the primary uses of the capacity requirements plan. Calculating the level of available capacity is an input to the capacity requirements plan, not an output. The level of available capacity is determined by the work center file, which contains information such as shifts, hours, efficiency, utilization, and maintenance of each work center. Determining the overall product load profile is not a use of the capacity requirements plan, as it does not consider the product mix or demand variability. The overall product load profile is a general estimate of the total production volume or demand over a period of time. Determining the priority of orders is not a use of thecapacity requirements plan, as it does not consider the due dates or urgency of orders. The priority of orders is determined by using priority rules or dispatching methods, such as first-come-first-served (FCFS), shortest processing time (SPT), earliest due date (EDD), or critical ratio (CR).
References := Capacity Requirements Planning (CRP): Definition and Procedures, Capacity Requirements Planning (CRP Plan and Strategies) - ERP Information, Definition of Capacity Requirements Planning (CRP) - Gartner …
A machine is suddenly having excessive downtime. Which of the following tools would be used in a root cause correctiveaction process to determine the problem?
Options:
Failure mode effects analysis (FMEA)
Standardized work analysis chart
Balance chart
A3 method
Answer:
DExplanation:
A3 method is a tool that can be used in a root cause corrective action process to determine the problem of a machine that is suddenly having excessive downtime. A3 method is a structured problem-solving approach that follows the Plan-Do-Check-Act (PDCA) cycle and uses a single sheet of paper (A3 size) to document the problem, analysis, countermeasures, and results1. A3 method can help identify the root cause of a problem by using tools such as the 5 Whys or the fishbone diagram, and then develop and implement effective corrective actions to prevent recurrence2. A3 method can also help communicate the problem and the solution to stakeholders, as well as monitor and evaluate the outcomes3.
The steps of the A3 method are4:
- Step 1: Define the problem and its impact. Describe the current situation, the gap between the actual and the desired state, and the scope and magnitude of the problem.
- Step 2: Identify the root cause of the problem. Use tools such as the 5 Whys or the fishbone diagram to analyze the factors that contribute to the problem and drill down to its root cause.
- Step 3: Propose countermeasures to address the root cause. Generate possible solutions that can eliminate or reduce the root cause, and evaluate their feasibility, effectiveness, and costs.
- Step 4: Implement countermeasures. Select the best solution and plan how to execute it. Define the roles, responsibilities, resources, timeline, and expected outcomes of the implementation.
- Step 5: Check results and process. Measure and compare the results before and after the implementation, and verify if the problem has been solved or improved. Also check if the process has been followed correctly and document any deviations or issues.
- Step 6: Standardize successful processes or identify unresolved issues. If the results are satisfactory, standardize the new process and ensure that it is sustained. If not, identify the remaining or new issues and repeat the A3 method.
Therefore, A3 method is a tool that can be used in a root cause corrective action process to determine the problem of a machine that is suddenly having excessive downtime.
References: 1: What is an A31 2: How to Use an A3 Report for Problem Solving 2 3: The A3 Problem Solving Method 4 4: The A3 Report – A Simple Tool for Complex Problems 5
The demonstrated capacity of equipment in a process flow is $1,200 per day. Due to a malfunction in a feeder line, utilization
of the equipment is reduced by 25% on Day 6. If the efficiency remains unchanged at 110%, what would the output be on Day 6?
Options:
$300
$330
$900
$990
Answer:
DExplanation:
The output of the equipment on Day 6 can be calculated by multiplying the demonstrated capacity, the utilization, and the efficiency. The demonstrated capacity is given as $1,200 per day. The utilization is the ratio of the actual time that the equipment is used to the available time that it could be used. Since the utilization is reduced by 25% on Day 6, it means that the equipment is used for 75% of the available time. Therefore, the utilization is 0.75. The efficiency is the ratio of the actual output to the standard output. It is given as 110%, which means that the equipment produces 10% more than the standard output. Therefore, the efficiency is 1.1. The output on Day 6 can be found by multiplying these three factors:
Output = Demonstrated capacity x Utilization x Efficiency Output = $1,200 x 0.75 x 1.1 Output = $990
Therefore, the output on Day 6 is $990. References: CPIM Part 2 Exam Content Manual, Version 7.0, Domain 6: Plan, Manage, and Execute Detailed Schedules, Section A: Detailed Capacity Planning and Scheduling, Subsection 2: Capacity Management Concepts and Calculations, p. 37-38.
Which of the following techniques would a group use to prioritize problems?
Options:
Critical path analysis
Pareto analysis
Scatter charts
Cause-and-effect diagrams
Answer:
BExplanation:
Pareto analysis is a technique that a group can use to prioritize problems. Pareto analysis is based on the Pareto principle, also known as the 80/20 rule, which states that 80% of the effects come from 20% of the causes1. Pareto analysis can help a group identify and focus on the most significant problems that account for the majority of the negative outcomes, and allocate their resources and efforts accordingly2.
The steps of Pareto analysis are3:
- Step 1: Define the problem and its scope. Clarify what the problem is, why it is important, and what are the desired outcomes.
- Step 2: Identify the causes of the problem. Brainstorm and list all the possible factors that contribute to the problem, such as people, processes, equipment, materials, environment, etc.
- Step 3: Collect data on the causes. Gather quantitative or qualitative data on how often or how much each cause affects the problem, such as frequency, severity, cost, time, etc.
- Step 4: Analyze the data using a Pareto chart. A Pareto chart is a type of bar chart that shows the frequency or impact of each cause in descending order, along with a cumulative line that shows the percentage of the total effect. A Pareto chart can help visualize which causes are more significant than others, and where the 80/20 split occurs.
- Step 5: Prioritize the causes and take action. Based on the Pareto chart, select the most critical causes that need to be addressed first, and develop and implement solutions to eliminate or reduce them. Monitor and evaluate the results and repeat the process if necessary.
Therefore, Pareto analysis is a technique that a group can use to prioritize problems by identifying and focusing on the most significant causes that account for the majority of the negative outcomes.
References: 1: The Pareto Principle - The 80/20 Rule Explained 1 2: How to Use Pareto Analysis to Improve Your Business 2 3: How to Perform a Pareto Analysis (Step-by-Step) 3
A manufacturer wishes to decrease the time-to-market for a new product family. Which of thefollowing strategies should beused?
Options:
Decrease the number of suppliers for components of the new product.
Decrease the purchasing lot size for the new product's components.
Increase collaboration between the buyer and the supplier of new components.
Increase the safety stocks for the new product's components.
Answer:
CExplanation:
Time-to-market (TTM) is the length of time it takes to develop a product from conception until it is released to the market and is available for sale1. Reducing TTM can provide a competitive advantage, as it can help a company to capture customer demand, respond to market changes, and increase profitability1.
One strategy to decrease TTM for a new product family is to increase collaboration between the buyer and the supplier of new components. Collaboration can involve sharing information, resources, risks, and rewards among supply chain partners to achieve mutual benefits2. By collaborating with the supplier of new components, the buyer can improve the quality, reliability, and innovation of the components, as well as reduce the costs, lead times, and uncertainties associated with them2. This can speed up the product development process and reduce the time and resources required to bring the new product family to the market.
The other options are not effective strategies to decrease TTM for a new product family. Decreasing the number of suppliers for components of the new product may reduce the complexity and variability of the supply chain, but it may also increase the dependency and vulnerability on a single or few suppliers, which may affect the availability and performance of the components3. Decreasing the purchasing lot size for the new product’s components may reduce the inventory carrying costs and risks, but it may also increase the ordering costs and frequency, which may affect the efficiency and responsiveness of the supply chain4. Increasing the safety stocks for the new product’s components may reduce the risk of stockouts and delays, but it may also increase the inventory carrying costs and risks, as well as tie up cash flow and working capital.
References : Time to market: Definition and strategies to speed up TTM; Time To Market (TTM) Defined & Why It’s Important | TCGen; Market Timing Tips Every Investor Should Know; Supply Chain Collaboration: Definition & Benefits; [Supplier Consolidation: Definition & Benefits]; [Economic Order Quantity (EOQ) Model: Definition & Formula]; [Safety Stock: The Ultimate Guide].
Which of the following tools is used for monitoring a capacity plan?
Options:
Demonstrated capacity
Resource planning
Input/output control (I/O)
Dispatch report &
Answer:
CExplanation:
Input/output control (I/O) is a type of tool that is used for monitoring a capacity plan. A capacity plan is a statement of the resources needed to meet the production plan over a medium-term horizon. A capacity plan can be stated in different units of measure depending on the type of manufacturing environment, such as hours, units, tons, or dollars. Input/output control (I/O) is a method of measuring and comparing the actual input and output of a work center or a production line against the planned input and output. Input is the amount of work that is released to the work center or the production line, and output is the amount of work that is completed by the work center or the production line. Input/output control (I/O) helps to monitor the performance and efficiency of the work center or the production line, and to identify any deviations or problems that may affect the capacity plan. Input/output control (I/O) also helps to adjust the input or output levels as necessary to maintain the balance between demand and supply, and to achieve the desired throughput.
References: CPIM Exam Content Manual Version 7.0, Domain 6: Plan, Manage, and Execute Detailed Schedules, Section 6.3: Monitor Detailed Schedules, Subsection 6.3.2: Describe how to monitor input/output control (I/O) (page 60).
The primary consideration in maintenance, repair, and operating (MRO) supply systems typically is:
Options:
order quantity.
stockout costs.
carrying costs.
shelf life.
Answer:
BExplanation:
Maintenance, repair, and operating (MRO) supply systems are systems that manage the inventory and procurement of the items that are used to support the production process, but are not part of the final product. MRO items include spare parts, tools, lubricants, cleaning supplies, safetyequipment, and office supplies. The primary consideration in MRO supply systems typically is stockout costs. Stockout costs are the costs associated with the inability to meet the demand for an item due to insufficient inventory. Stockout costs can include lost sales, customer dissatisfaction, production downtime, emergency orders, and reputation damage. Stockout costs can be very high for MRO items, especially if they are critical for the operation and maintenance of the production equipment. Therefore, MRO supply systems should aim to minimize the risk of stockouts by ensuring adequate availability and accessibility of MRO items.
References: CPIM Exam Content Manual Version 7.0, Domain 5: Plan and Manage Inventory, Section 5.2: Implement Inventory Plans, Subsection 5.2.3: Describe how to implement inventory replenishment techniques (page 46).
One way to mitigate liability risk in the supply chain is to:
Options:
negotiate lower component cost.
require traceability for components.
push inventory to supplier locations.
use less-than-truckload (LTL) shipments more frequently.
Answer:
BExplanation:
Liability risk in the supply chain is the risk that a company may be held legally responsible for damages caused by its products or services, or by its business partners, such as suppliers, subcontractors, or customers1. Liability risk can result in financial losses, legal penalties, reputational damage, and customer dissatisfaction1.
One way to mitigate liability risk in the supply chain is to require traceability for components, which means the ability to track the origin, history, location, and status of a product or its parts throughout the supply chain2. Traceability can help a company to identify and prevent potential quality issues, defects, recalls, counterfeits, or frauds that may cause harm to the customers or the environment2. Traceability can also help a company to comply with regulatory standards, customer requirements, and social responsibility expectations2. Traceability can be achieved by using various methods, such as barcodes, RFID tags, serial numbers, blockchain, or cloud-based platforms3.
The other options are not effective ways to mitigate liability risk in the supply chain. Negotiating lower component cost may reduce the procurement expenses, but it may also compromise the quality and safety of the components, which may increase the liability risk. Pushing inventory to supplier locations may reduce the inventory carrying costs and risks, but it may also increase the dependency and vulnerability on the suppliers, which may expose the company to more liability risk. Using LTL shipments more frequently may reduce the transportation costs and emissions, but it may also increase the handling and damage risks of the products, which may affect the customer satisfaction and liability.
References : Understanding Supply Chain Risk: Liabilities | Avetta; What is Traceability in Supply Chain Management?; How to Achieve Supply Chain Traceability.
A life cycle assessment (LCA) would be used to determine:
Options:
the length of a long-term agreement.
how an item should be scheduled.
environmental aspects and impacts.
if risk pooling would reduce inventory investment.
Answer:
CExplanation:
A life cycle assessment (LCA) would be used to determine environmental aspects and impacts. Environmental aspects are the elements or characteristics of a product or service that can interact with the environment, such as emissions, energy use, water use, waste generation, etc. Environmental impacts are the effects or consequences of the environmental aspects on the environment, such as climate change, acidification, eutrophication, human health, biodiversity, etc1
A life cycle assessment (LCA) is a systematic analysis of the potential environmental impacts of products or services during their entire life cycle. During an LCA, you evaluate the potential environmental impacts throughout the entire life cycle of a product (production, distribution, use and disposal) by considering all the relevant environmental aspects and their interactions with the environment23
An LCA can help you:
- Identify the most significant environmental aspects and impacts of your product or service
- Compare the environmental performance of different products or services
- Find opportunities to reduce the environmental impacts and improve the environmental performance of your product or service
- Communicate the environmental benefits of your product or service to your customers, stakeholders, and regulators
Therefore, an LCA would be used to determine environmental aspects and impacts.
References: 1: Environmental Aspect Definition 2: Life-cycle assessment - Wikipedia 1 3: Life Cycle Assessment (LCA) - Complete Beginner’s Guide - Ecochain 2
Potential reasons to make instead of buy a product may include:
Options:
maintain core competencies, increase capital expense, and reduce cost.
less capital investment, large volume changes, and reduce cost.
maintain quality, reduce cost, and keep confidential processes within the firm.
eliminate risks associated with single sourcing, create intermittent flow, and reduce cost.
Answer:
CExplanation:
According to the CPIM Exam Content Manual, a make-or-buy decision is a strategic decision that involves choosing between manufacturing a product or service internally or purchasing it from an external supplier1. A make-or-buy decision is based on a cost-benefit analysis that considers various factors, such as quality, cost, capacity, lead time, technology, and competitive advantage2.
Some of the potential reasons to make instead of buy a product may include:
- Maintain quality: Making a product internally may allow the firm to control and ensure the quality standards of the product, which may affect customer satisfaction and loyalty. Buyinga product from an external supplier may involve quality risks or uncertainties, especially if the supplier is located in a different country or has different quality systems3.
- Reduce cost: Making a product internally may reduce the total cost of ownership of the product, which includes not only the purchase price, but also the costs of transportation, inventory, inspection, warranty, and maintenance. Buying a product from an external supplier may incur higher total costs due to these factors.
- Keep confidential processes within the firm: Making a product internally may protect the firm’s proprietary or confidential processes that give it a competitive edge in the market. Buying a product from an external supplier may expose the firm’s processes to potential imitation or leakage.
Therefore, the correct answer is C. maintain quality, reduce cost, and keep confidential processes within the firm.
References:
- CPIM Exam Content Manual
- Make-or-Buy Decision Explained: How to Make Outsourcing Decisions
- Make or Buy Decision - What Is It, Examples, Factors, Advantages
- Make-or-Buy Decision - Overview, How It Works, Triggers
- Make or Buy Decision - Definition & Examples | Marketing Tutor
Staging in a manual system corresponds to which of the following functions in a computer system?
Options:
Order release
Allocation
Dispatching
Bill-of-material explosion
Answer:
CExplanation:
Staging in a manual system corresponds to dispatching in a computer system. Staging is the process of preparing and moving materials or components to the point of use or consumption in a production system1. Staging can be done manually by workers who physically move the items from storage areas to workstations, or automatically by conveyors, robots, or other devices2. Dispatching is the process of authorizing and releasing work orders or tasks to the production system3. Dispatching can be done manually by supervisors who assign work to workers, or automatically by computer systems that use algorithms or rules to prioritize and schedule work4. Both staging and dispatching are functions that facilitate the flow of materials and information in a production system and ensure that the right items are available at the right time and place.
References: CPIM Part 2 Exam Content Manual, Domain 6: Plan, Manage, and Execute Detailed Schedules, Section 6.1: Detailed Scheduling Concepts and Tools, p. 75-76; Staging (manufacturing) - Wikipedia; Staging - an overview | ScienceDirect Topics; Dispatching - an overview | ScienceDirect Topics; Dispatching: Meaning, Objectives, Importance and Procedure.
The most relevant measure of customer service performance is:
Options:
service perceived by the customer against service expected by the customer.
service promised to the customer against service measured by the supplier.
customer complaints received as a percentage of orders shipped.
positive customer feedback as a percentage of customer feedback.
Answer:
AExplanation:
Customer service performance is the degree to which a product or service meets or exceeds customer expectations. The most relevant measure of customer service performance is how the customer perceives the service compared to what they expected. This measure reflects the customer’s satisfaction and loyalty, which are key factors for business success. Other measures, such as service promised versus measured, customer complaints, or positive feedback, are more related to the supplier’s perspective and may not capture the customer’s true perception of service quality. References : CPIM Part 2 Exam Content Manual, Domain 3: Plan and Manage Demand, Section A: Demand Management, Subsection 4: Customer Service Management, Page 11.
In an assemble-to-order (ATO) environment, option overplanning is used to:
Options:
address uncertainty in the product mix.
verify appropriate inventory levels,
schedule detailed production.
compensatesfor forecast bias.
Answer:
AExplanation:
Option overplanning is a technique used in an assemble-to-order (ATO) environment to address uncertainty in the product mix. An ATO environment is a production strategy where products are assembled from components or subassemblies after receiving customer orders1. Option overplanning is the practice of planning and stocking more components or subassemblies than the expected demand, based on historical data or forecasts2. The purpose of option overplanning is to increase the flexibility and responsiveness of the production system, by allowing the manufacturer to meet a variety of customer orders with different options or features. Option overplanning can help reduce the risk of stockouts, improve customer service, and capture new market opportunities.
Option overplanning is not used to verify appropriate inventory levels, schedule detailed production, or compensate for forecast bias. Verifying appropriate inventory levels is a function of inventory management, which involves monitoring and controlling the quantity and quality of materials and products in stock. Scheduling detailed production is a function of detailed scheduling, which involves allocating resources and setting priorities for specific tasks or orders in the production process. Compensating for forecast bias is a function of demand management, which involves adjusting the forecasts based on the difference between the actual and predicted demand.
References: Assemble-to-Order (ATO): Overview, Examples, Pros and Cons - Investopedia; Assemble-to-Order - Overview, How It Works, Advantages; [Assemble-to-Order (ATO) Definition | Operations & Supply Chain Dictionary]; [Assemble-to-Order (ATO) - MBA Skool-Study.Learn.Share.]; [InventoryManagement - Definition, Types, Objectives and Examples]; [Detailed Scheduling - an overview | ScienceDirect Topics]; [Forecast Bias - an overview | ScienceDirect Topics].
The horizon for forecasts that are input to the sales and operations planning (S&O0P) process should be long enough that:
Options:
cumulative forecast deviation approaches zero.
planned product launches can be incorporated.
required resources can be properly planned.
supply constraints can be resolved.
Answer:
CExplanation:
The horizon for forecasts that are input to the sales and operations planning (S&OP) process should be long enough that required resources can be properly planned. The S&OP process is a cross-functional process that aligns the demand and supply plans of an organization. The S&OP process consists of several steps, such as data gathering, demand planning, supply planning, pre-S&OP meeting, executive S&OP meeting, and S&OP implementation. The output of the S&OP process is the production plan, which is a statement of the resources needed to meet the aggregate demand plan over a medium-term horizon. The production plan can be stated in different units of measure depending on the type of manufacturing environment, such as hours, units, tons, or dollars. The horizon for forecasts that are input to the S&OP process should be long enough that required resources can be properly planned, meaning that the organization can anticipate and allocate the necessary capacity, materials, labor, equipment, and facilities to meet the expected demand. The horizon for forecasts should also match the lead time for acquiring or changing the resources, as well as the planning cycle for updating the production plan.
References: CPIM Exam Content Manual Version 7.0, Domain 4: Plan and Manage Supply, Section 4.1: Develop Supply Plans, Subsection 4.1.2: Describe how to develop a production plan (page 36).
Which of the following strategies can improve the effectiveness of a company's customer value proposition and enhance itsdifferentiation in the market?
Options:
Relocate high-cost activities to other geographic areas.
Outsource activities to outside vendors or contractors.
Invest in productivity enhancing technological improvements.
Adopt best practices that improve product design.
Answer:
DExplanation:
A customer value proposition (CVP) is a statement that summarizes the benefits that a product or service offers to a target customer segment1. A CVP can help a company differentiate itself from its competitors by highlighting its unique value proposition (UVP), which is the main reason why customers should choose its product or service over others2. A CVP can also help a company communicate its value to its customers, increase customer satisfaction and loyalty, and improve its market position3.
One of the strategies that can improve the effectiveness of a CVP and enhance its differentiation in the market is to adopt best practices that improve product design. Product design is the process of creating a new product or service that solves a customer problem or fulfills a customer need4. By improving product design, a company can create products or services that are more desirable, feasible, and viable for its customers5. Some of the best practices that can improve product design are:
- Understanding the customer: conducting research and analysis to identify the customer segments, their jobs, pains, and gains, and their expectations and preferences. This can help create products or services that are tailored to the customer needs and wants, and deliver value that exceeds their expectations.
- Using the Value Proposition Canvas: a tool that helps design, test, create, and manage products and services that customers actually want. The Value Proposition Canvas consists of two parts: the Customer Profile, which describes the customer segment in terms of their jobs, pains, and gains; and the Value Map, which describes how the product or service creates value for the customer by addressing their jobs, relieving their pains, and creating their gains. The Value Proposition Canvas can help align the product or service with the customer needs and wants, and create a fit between them.
- Applying design thinking: a human-centered approach to innovation that integrates the needs of people, the possibilities of technology, and the requirements of business. Design thinking involves five phases: empathize, define, ideate, prototype, and test. Design thinking can help create products or services that are desirable for the customers, feasible for the technology, and viable for the business.
- Incorporating feedback loops: collecting and analyzing data from customers and stakeholders to measure the performance and impact of the product or service. Feedback loops can help validate the assumptions and hypotheses about the customer needs and wants, test the effectiveness of the value proposition, and identify areas for improvement or innovation.
Therefore, by adopting best practices that improve product design, a company can create products or services that deliver superior value to its customers, and differentiate itself from its competitors in the market.
References: 1: Customer Value Proposition Definition 3 2: Unique Value Proposition Definition 4 3: How to Write a Value Proposition (+ 6 Modern Examples) 5 4: Product Design Definition 5: What is Product Design? : Customer Discovery: The Ultimate Guide : Value Proposition Canvas – Download the Official Template 3 : What is Design Thinking? : Feedback Loop Definition
A company sold 8,400 units last year. Average inventory investment was $42,000. Whatwas the inventory turns ratio,knowing that the unit cost is $207?
Options:
0.20
0.25
4
5
Answer:
DExplanation:
The inventory turns ratio is a financial metric that measures how efficiently a company manages its inventory. The inventory turns ratio is calculated by dividing the cost of goods sold (COGS) by the average inventory investment. The cost of goods sold is the direct cost of producing or purchasing the goods sold by the company. The average inventory investment is the average value of the inventory held by the company over a period of time. A higher inventory turns ratio indicates a higher inventory turnover and a lower inventory holding cost.
In this case, the company sold 8,400 units last year, and the unit cost is $207. Therefore, the cost of goods sold is:
COGS = Unit cost x Units sold = 207 x 8,400 = $1,738,800
The average inventory investment was $42,000. Therefore, the inventory turns ratio is:
Inventory turns ratio = COGS / Average inventory investment = 1,738,800 / 42,000 = 41.4
To express the inventory turns ratio as a whole number, we can round it to the nearest integer. Therefore, the inventory turns ratio is 5.
References: CPIM Exam Content Manual Version 7.0, Domain 5: Plan and Manage Inventory, Section 5.1: Develop Inventory Plans, Subsection 5.1.2: Describe how to develop an inventory policy (page 44).
A company has prioritized customers A, B, and C, filling orders in that sequence. What are the impacts to customer servicelevels for customers B and C?
Options:
100% service levels for B and C
Customer B has higher service level
Customer C has higher service level
Customer B and C have same service level
Answer:
BExplanation:
A company that has prioritized customers A, B, and C, filling orders in that sequence, will have an impact on the customer service levels for customers B and C. Customer service level is the percentage of orders that are fulfilled on time and in full. The higher the customer service level, the more satisfied the customer is with the company’s performance. When a company prioritizes customers based on their importance, value, or profitability, it means that it allocates its resources and capacity to serve the most preferred customers first, and then the less preferred customers later. This can result in different customer service levels for different customer segments. In this case, customer A is the most preferred customer, followed by customer B and then customer C. Therefore, customer A will receive the highest customer service level, as the company will fill its orders first and ensure that they are delivered on time and in full. Customer B will receive the second highest customer service level, as the company will fill its orders after customer A’s orders are fulfilled. Customer B may experience some delays or shortages if the company runs out of resources or capacity after serving customer A. Customer C will receive the lowest customer service level, as the company will fill its orders last, after customer A’s and B’s orders are completed. Customer C may face longer delays or higher shortages if the company has exhausted its resources or capacityafter serving customer A and B. Therefore, the impact of prioritizing customers A, B, and C is that customer B has a higher service level than customer C. References := How to Prioritize Customer Requests - Gladly, Support Ticket Prioritization - 6 Best Practices to follow, [Customer Service Level: Definition & Calculation]
An order that moves into a work center on schedule following completion of a previous operation will move:
Options:
to the end of the queue.
to the beginning of the queue.
into the queue in priority sequence.
into the queue when there is capacity available.
Answer:
CExplanation:
A queue is the number of hours that a work order sits in front of a work center before it starts. It also includes the move time required to physically move partially completed items from the previous operation to the next work center1. A queue is used to provide a buffer between the time that a component arrives at a machine or work center and when the operation actually starts2. A queue can help to neutralize delays in previous operations and to reduce the waiting time and flow time of the work orders3.
An order that moves into a work center on schedule following completion of a previous operation will move into the queue in priority sequence. This means that the order will be placed in the queue according to its priority level, which is determined by the priority control technique used for the production system. A priority control technique is a method of determining the sequence and timing of production orders in a manufacturing system4. Some examples of priority control techniques are first-come, first-served (FCFS), shortest processing time (SPT), earliest due date (EDD), and critical ratio (CR). Depending on the priority control technique, an order may move to the beginning, end, or middle of the queue.
An order will not necessarily move to the end or the beginning of the queue, as these positions depend on the priority level of the order and the other orders in the queue. An order will not move into the queue when there is capacity available, as this implies that there is no queue at all. Capacity is the amount of time or resources available for production at a work center5. Capacity can be affected by factors such as machine availability, labor skills, setup time, and maintenance. Capacity planning is a function of determining and adjusting the optimal level of resources needed to meet the demand5.
Providing a realistic basis for setting internal performance targets can be accomplished through:
Options:
beta testing.
benchmarking.
breakthrough innovation.
best practices.
Answer:
BExplanation:
Providing a realistic basis for setting internal performance targets can be accomplished through benchmarking. Benchmarking is a process of comparing one’s own performance, processes, or practices with those of other organizations that are recognized as leaders or best in class in a specific area. Benchmarking can help identify gaps, strengths, weaknesses, opportunities, and threats in one’s own performance, as well as learn from the experiences and successes of others. Benchmarking can also help set realistic, achievable, and challenging goals and targets for improvement, based on external standards or benchmarks. Benchmarking can be done internally(within the same organization), externally (with other organizations in the same industry or sector), or functionally (with other organizations that perform similar functions or processes).
Beta testing is not a way of providing a realistic basis for setting internal performance targets. Beta testing is a stage of product development where a sample of potential users or customers test a product or service before it is released to the general public. Beta testing can help identify and fix any bugs, errors, or issues in the product or service, as well as collect feedback and suggestions for improvement. Beta testing can also help evaluate the usability, functionality, and quality of the product or service, as well as measure customer satisfaction and loyalty. Beta testing is not related to setting internal performance targets, as it is focused on the product or service, not the organization.
Breakthrough innovation is not a way of providing a realistic basis for setting internal performance targets. Breakthrough innovation is a type of innovation that creates significant value for customers and markets by introducing new products, services, or business models that are radically different from existing ones. Breakthrough innovation can help create competitive advantage, disrupt existing markets, or create new markets. Breakthrough innovation is not related to setting internal performance targets, as it is focused on the outcome, not the process.
Best practices are not a way of providing a realistic basis for setting internal performance targets. Best practices are methods or techniques that have been proven to be effective and efficient in achieving desired results or outcomes. Best practices can be derived from one’s own experience, research, or benchmarking. Best practices can help improve performance, quality, or productivity by adopting proven solutions or standards. Best practices are not related to setting internal performance targets, as they are focused on the implementation, not the measurement.
References := Benchmarking - Wikipedia, Benchmarking: Definition & Process | Study.com, What Is Benchmarking? Definition And Examples, What Is Beta Testing? Definition And Examples, What Is Breakthrough Innovation? Definition And Examples, What Are Best Practices? Definition And Examples
An organization has seen inventory increase every month for the past year and financial performance has net met expectations. Which of the following processes would mostappropriately address correctingthe problem?
Options:
Business planning
Sales and operations planning (S&OP)
Detailed material planning
Master scheduling
Answer:
BExplanation:
Sales and operations planning (S&OP) is a process that aligns the sales plan, the production plan, the inventory plan, and the financial plan to achieve the business objectives. S&OP helps to balance supply and demand, optimize resources, reduce inventory costs, and improve customer service. S&OP is done on an aggregate or family level, and covers a sufficient span of time to make sure that the necessary resources will be available. S&OP also involves regular reviews and updates of the plans based on the changes in the market and the company’s performance.
Business planning is a process that defines the long-term vision, mission, goals, and strategies of the organization. Business planning provides the direction and framework for the operational plans, but does not address the specific issues of inventory management and financial performance.
Detailed material planning is a process that determines the quantity and timing of material requirements for each item or component in the production plan. Detailed material planning is based on the master schedule, which is derived from the S&OP. Detailed material planning does not address the alignment of sales and operations at an aggregate level.
Master scheduling is a process that translates the S&OP into a detailed plan for each product or service in a specific time period. Master scheduling specifies the quantityand timing of finished goods to be produced or delivered to meet the demand. Master scheduling is dependent on the S&OP, and does not address the coordination of sales and operations at an aggregate level.
References:
- APICS Exam Handbook, page 12
- CPIM Part 1 Study Guide, page 19
- CPIM Part 2 Study Guide, page 17
- Sales and Operations Planning (S&OP) 101| Smartsheet
- Sales, Inventory & Operations Planning - What It Is and How to Operate
Which of the following factors is considered a carrying cost?
Options:
Setup
Transportation
Obsolescence
Scrap rate
Answer:
CExplanation:
Obsolescence is the loss of value or usefulness of an item due to changes in technology, fashion, customer preferences, or other factors. Obsolescence is considered a carrying cost, because it is an expense associated with holding inventory over a period of time1. Carrying costs are the various costs a business pays for holding inventory in stock, such as warehousing, insurance, taxes, depreciation, and opportunity costs2. Obsolescence can increase the carrying costs of inventory,because it can reduce the demand and sales potential of the item, and may require the item to be written off or sold at a lower price3.
The other options are not considered carrying costs, because they are not related to holding inventory in stock. Setup is the cost of preparing a machine or a process for production. Transportation is the cost of moving goods from one place to another. Scrap rate is the percentage of defective or unusable units produced in a process. These costs are more related to production or distribution activities than inventory holding activities.
PDF + Testing Engine

Testing Engine
PDF (Q&A)